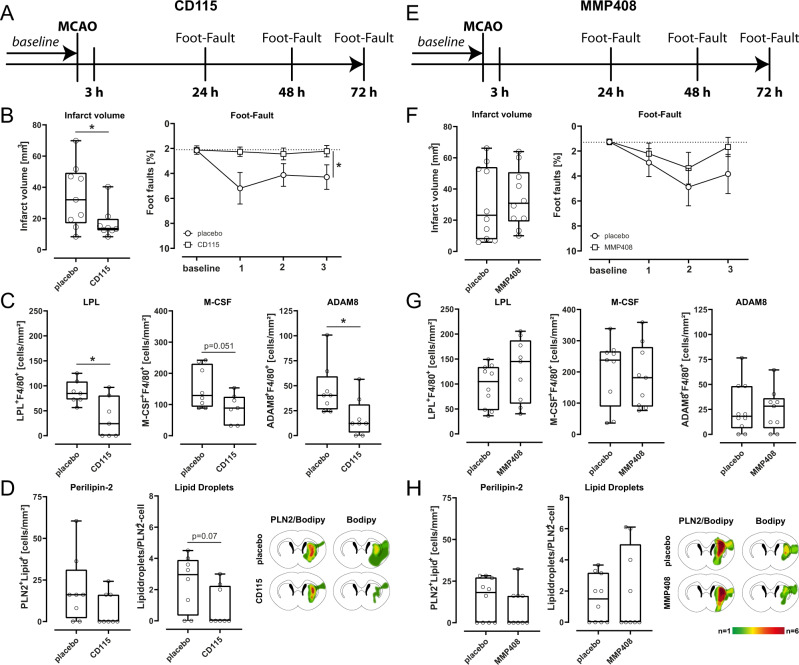
Fig. 5. Specific SAMC blocking treatment influences stroke outcome and immune cell response.
A, E Schematic illustration of A M-CSF antibody (CD115) and E MMP-12 inhibitor (MMP408) application over time. Middle cerebral artery occlusion (MCAO) (or sham-operated, as controls) was induced in mice for 45 min. Mice were either injected with anti-CSF-1R mAb (CD115, M-CSF antibody) intraperitoneally at doses of 400 μg/mouse in 100 μl PBS or perorally administered with MMP408 (MMP-12 inhibitor) at doses of 750 μg/mouse in 100 μl PBS 3, 24, and 48 h after induction of MCAO. Functional outcome was assessed with foot fault performances 24, 48, and 72 h after MCAO. Seventy-two hours post-ischemia mice were intracardially perfused and tissue sections were analyzed by immunohistochemistry. B, F Mean infarct volumes were calculated from coronal cryosections (15–20) of mice treated with M-CSF antibody or MMP-12 inhibitor in comparison to vehicle-treated animals collected at 300 µm intervals and stained with toluidine blue using ImageJ software at 72 h after MCAO (two-sided t-test, *p < 0.05, n = 8 per group; M-CSF antibody: p = 0.0360; MMP-12 inhibitor: p = 0.3131). Median infarct volumes were presented as box plots. The lines inside the boxes denote the medians. The whiskers of box plots: 10–90%. The behavioral performances of the mice in each group were measured with the foot fault test at 24, 48, and 72 h post ischemia (p < 0.05, two-sided t-test, n = 9 per group). Data are presented as mean values ± SEM. C, G Quantification of LPL+/F4/80+,M-CSF+/F4/80+ and ADAM8 + /F4/80+ cells at 72 h post stroke induction after blocking therapy with SAMC-specific markers M-CSF and MMP12 in comparison to vehicle-treated animals (*p < 0.05, **p < 0.01, two-sided t-test, n = 9 per group). M-CSF antibody: LPL + /F4/80 + : p = 0.0134; M-CSF + /F4/80 + : p = 0.051;ADAM8 + /F4/80 + p = 0.0253. Median cell counts were presented as box plots. The lines inside the boxes denote the medians. The whiskers of box plots: 10–90%. D, H The density of Perilipin-2 and BODIPY positive cells was quantified on cryosections at bregma 0–1 mm 72 h post-MCAO (*p < 0.05, two-sided t-test, n = 9 per group). Cells were quantified within the region of interest (ROI: striatum of the ischemic hemisphere, measuring 0.256 mm2) on coronal sections at 20x magnification, and heatmaps were generated from brains post 72 h (n = 8) (two-sided t-test, *p < 0.05). Median cell counts were presented as box plots. The lines inside the boxes denote the medians. The whiskers of box plots: 10–90%. Source data for B, C, D, F, G, and H are provided as a Source Data file.

