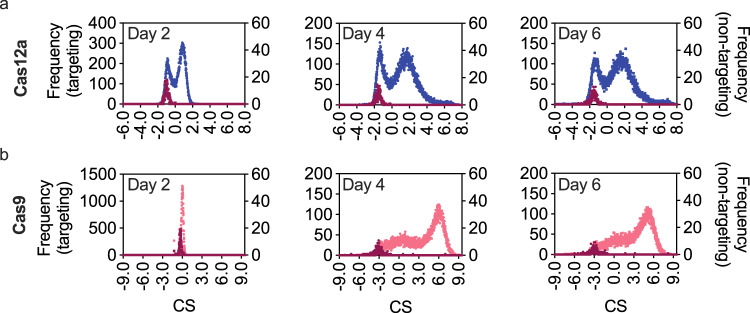
Fig. 2. CRISPR-Cas12a and CRISPR-Cas9 cutting score (CS) distributions in Yarrowia lipolytica.
CS distributions were calculated across 3 separate days after subculturing transformants twice when they reached confluency. Blue and pink distributions plotted on the left y-axis show CS values of Cas12a and Cas9 libraries, while the dark red data plotted with the right y-axis depicts the non-cutting control population, constituting ~1% of the respective library. The higher the value of CS, the better the cutting activity of the sgRNA. a Histogram of CS values in Cas12a library. b Histogram of CS values in Cas9 library. The CS values at Day 4 for both Cas9 and Cas12a were carried forward for further analysis.

