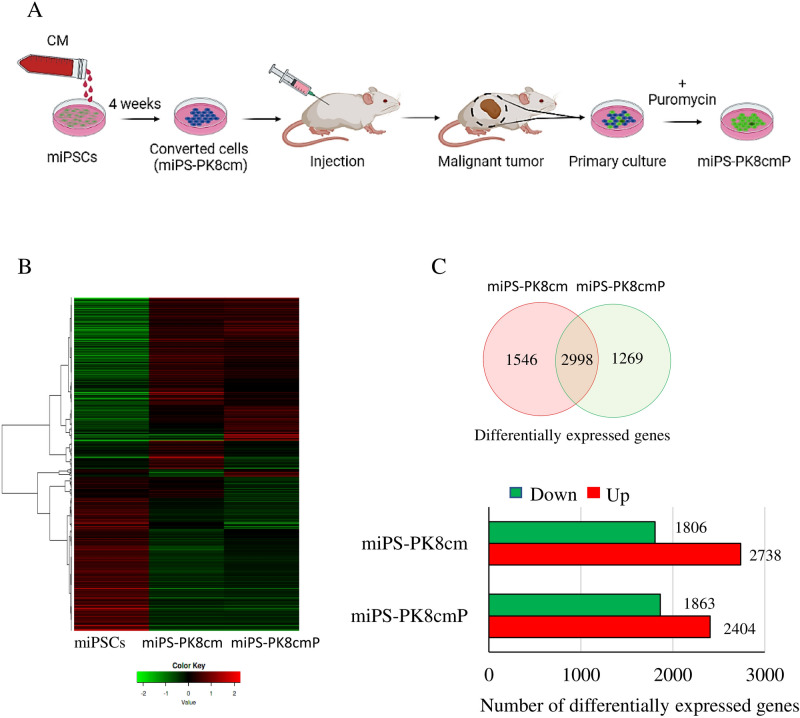
Figure 1.
Analysis of transcriptomes of CSCs converted from miPSCs by RNA-seq. (A) Schematic chart of conversion of miPSCs into CSCs, converted cells were prepared by culturing miPSCs in 50% CM, then cells were transplanted into mice and CSCs were isolated from the primary culture of the tumors. (B) A heat map of gene expression in miPSCs, miPS-PK8cm, and miPS-PK8cmP cells. (C) A Venn diagram showing the differentially expressed genes in miPS-PK8cm and miPS-PK8cmP cells when compared with those in miPSCs and the bar graph depicting the number of up- and downregulated genes in miPS-PK8cm and miPS-PK8cmP cells when compared with those in miPSCs.

