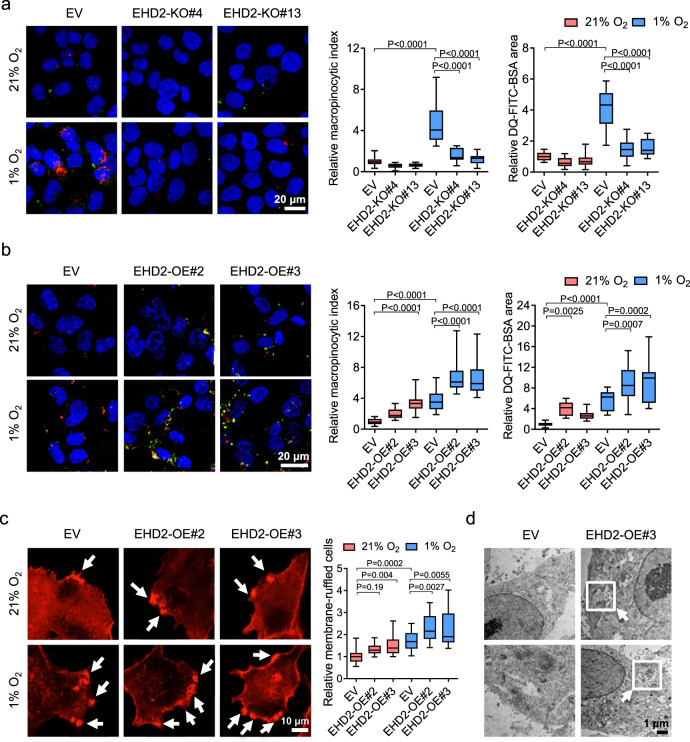
Fig. 4. EHD2 promotes macropinocytosis through actin remodeling.
a. Confocal images show dextran uptake/macropinosomes (red) and FITC-BSA degradation (green) of MHCC97L-EV, -EHD2-KO#4, and -EHD2-KO#13 exposed to 21 and 1% O2. b Confocal images reveal dextran uptake/macropinosomes (red) and FITC-BSA degradation (green) of MHCC97L-EV, -EHD2-OE#2, and -EHD2-OE#3 cells exposed to 21 and 1% O2. c Super high-resolution images show actin filaments (phalloidin, red) in MHCC97L-EV, -EHD2-OE#2, and -EHD2-OE#3 cells exposed to 21 and 1% O2. Arrows indicate the membrane ruffles. Percentage of cells with membrane ruffles was normalized to 21% O2 EV. d Images acquired by transmission electronic microscope (TEM) in MHCC97L-EV and -EHD2-OE#3 cells exposed to 21% O2. Arrows point to the macropinosomes in MHCC97L-EHD2-OE cells. a, b Macropinocytic indexes and DQ-FITC-BSA particle areas were normalized to 21% O2 EV. a–c Results were from 3 independent experiments. d Results were representative from n = 5 imaging analysis. Scatter plot: center line, mean. Box-and-whisker: center line, median; box limits, 25th to 75th percentiles; whiskers, min to max. Two-way ANOVA with Bonferroni correction. Source data are provided as a Source Data file.

