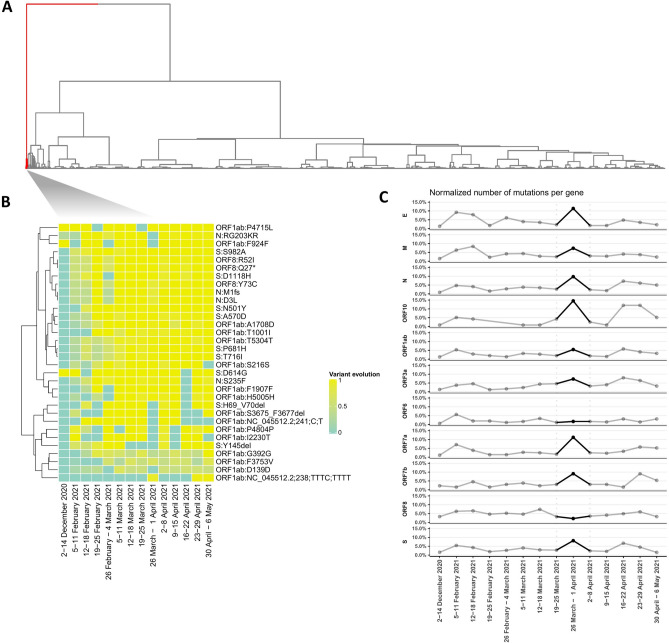
Figure 2.
Unsupervised mutation clustering was performed on a table containing all amino acid substitutions (A) Hierarchical clustering shows the clustered collapsed amino acid substitution using the Euclidean distance as a distance metric and ward.D as a clustering method. (B) Hierarchical clustering based on the cluster 1 of the (A). The heatmap shows the mutation evolution across the different periods. (C) Number of mutations per gene across the different periods. The values of the plot were normalized based on the length of each gene.

