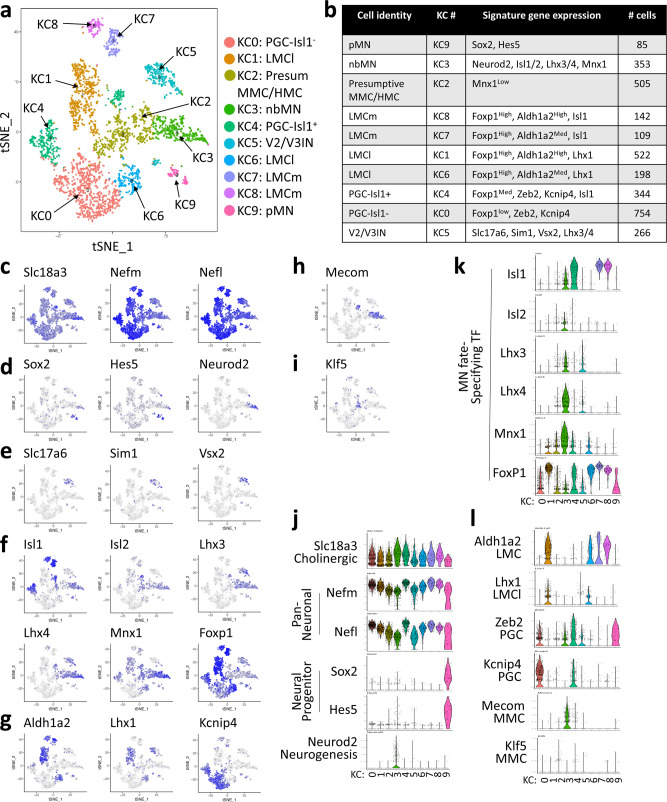
Fig. 6. Single-cell transcriptome analyses of Kdm6b-deficient MN lineage cells.
a, b Unsupervised clustering analysis of the single-cell transcriptomes of Slc18a3+ from E12.5 Kdm6b-cKO spinal cord (Kdm6bf/f; Olig2-Cre;mTmG). 10 knockout clusters (KC), KC0 to KC9, were visualized using tSNE. Cell types were assigned according to the expression of specific marker genes. Each dot represents a single cell and was color-coded based on the cluster identity. c–i tSNE plots to show the expression of the indicated genes in each plot. The expression levels of the genes were indicated by blue color intensity. j-l Violin plots for selected marker genes in KC0-KC9.

