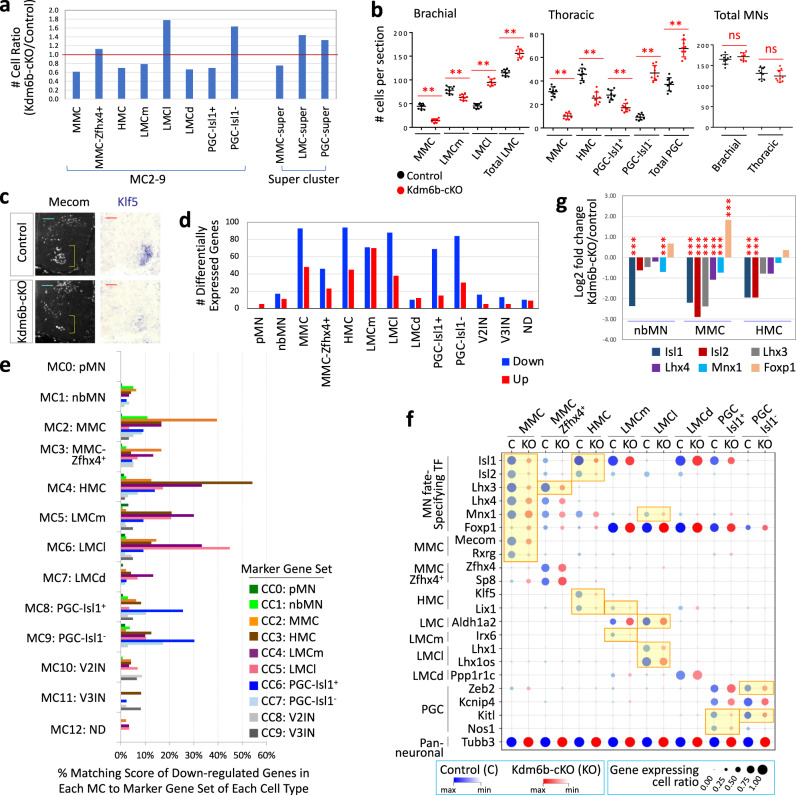
Fig. 8. Kdm6b promotes MMC and HMC fates and suppresses LMC and PGC identities in part by regulating the expression levels of MN fate-specifying TFs.
a The ratio of Kdm6b-cKO cells over control cells in MC for each MN subtype or “super-cluster” marked as MMC-super (MMC and MMC-Zfhx4+), LMC-super (LMCl, LMCm, and LMCd), or PGC-super (PGC-Isl1+ and PGC-Isl1−). b Quantification of MN numbers per 12 μm thick section of E12.5 spinal cords. MN subtypes were defined based on the following criteria; for the brachial spinal cord, MMC, Lhx3+ cells in the ventral spinal cord; LMCm, Foxp1+Isl1+ cells in the ventro-lateral area; LMCl, Foxp+Isl1− cells in the ventro-lateral area; total LMC, all Foxp1+ cells in the ventro-lateral area; total MNs, MMC and LMC; for the thoracic spinal cord, MMC, Isl1+Lhx3+ cells in the ventral spinal cord; HMC, Isl1+Lhx3− cells in the ventral spinal cord; PGC-Isl1+; Foxp1+Isl1+ cells in the intermediate spinal cord; PGC-Isl1−, Foxp1+Isl1− cells in the intermediate spinal cord; total PGC, all Foxp1+ cells in the intermediate spinal cord; total MNs, MMC, HMC, and PGC. Foxp1+ LMC and PGC MNs at brachial and thoracic levels, respectively, were divided by the presence (LMCm, PGC-Isl1+) and absence (LMCl, PGC-Isl1−) of Isl1. Data are presented as mean values + /− standard deviation. **p < 0.01; ns non-significant in the two-tailed Student’s t-test. n = 3–6 mice per genotype and 9 slices per genotype. The exact p-values are as follows. Brachial, MMC, 5.78 × 10⁻¹⁰; LMCm, 2.4 × 10⁻⁴; LMCl, 1.24 × 10⁻¹¹; total LMC, 9.94 × 10⁻⁹. Thoracic, MMC, 8.05 × 10⁻¹⁰; HMC, 3.69 × 10⁻⁷; PGC-Isl1+, 2.65 × 10⁻⁵; PGC-Isl1-, 1.75 × 10⁻¹¹; total PGC, 2.67 × 10⁻⁸. c Immunohistochemical analyses for Mecom and in situ hybridization analyses for Klf5 in E12.5 spinal cords. Mecom+ MMC (brackets) and Klf5+ HMC MNs decreased in Kdm6b-cKO mice. Scale bars, 50 μm. 3–6 sections in 3 embryos were analyzed and the representative images were shown. d The number of differentially expressed genes (DEG) between Kdm6b-cKO and control cells in MC0-MC12 clusters (FDR < 0.01, absolute log2 fold change > 0.8). Up- and down-regulated genes were marked by red and blue, respectively. e Pairwise comparison of the genes significantly down-regulated in each MC to the marker gene sets in CC0-CC9. Matching scores show the percentage of each MC’s down-regulated genes among the marker gene sets in CC0-CC9. A substantial portion of the specific marker genes for each MN subtype was down-regulated in Kdm6b-cKO cells. f Expression levels of marker genes in control (C, blue dots) and Kdm6b-cKO (KO, red dots) across MN subtype clusters. The size of dots indicates the ratio of the gene expressing cells among all control or Kdm6b-cKO cells in each cluster. The color intensity denotes the relative gene expression levels in control (blue) or Kdm6b-cKO (red). DEGs (FDR < 0.01, absolute log2 fold change > 0.8) are highlighted in yellow. g Relative gene expression levels of MN fate-specifying TFs between Kdm6b-cKO and control cells in nbMN, MMC, and HMC clusters. In Kdm6b-cKO, Isl1/2, Lhx3/4, and Mnx1 expression decreased, while Foxp1 expression was increased. ***p.adj < 0.001. The p-value was calculated using the WilcoxDETest function in Seurat package, in which a two-sided alternative hypothesis testing is performed. Multiple testing correction was carried out using the p.adjust function with –fdr option in R package. The exact p-values are as follows. nbMN, Isl1, 1.58E–23; Mnx1, 5.29E–05. MMC, Isl1, 7.53E–47; Isl2, 6.59E–60; Lhx3, 1.48E–68; Lhx4, 3.32E–24; Mnx1, 4.23E–09; Foxp1, 1.53E–08. HMC, Isl1, 5.60E–28; Isl2, 2.82E–13.

