
Figure 4.
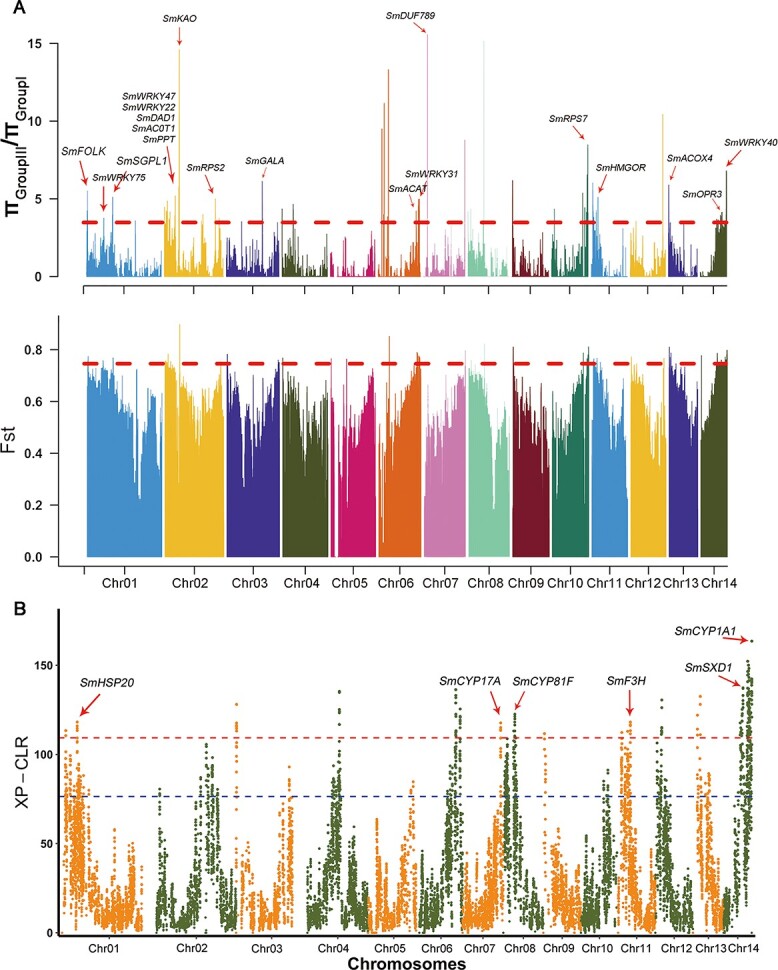
Genome-wide detection and annotation of selective sweeps in 104 S. mukorossi accessions. a Selective sweeps were identified by πGroupIII/πGroupI and FST. The red dashed line corresponds to the thresholds for very high significance in the top 5% of the highest values. b Manhattan plots of the CLRs among the Group I and Group III S. mukorossi populations. Red and blue dashed lines indicate the threshold for the top 1% and top 5% of CLR values, respectively. Genes located within the significant CLR peaks and corresponding annotations are denoted.