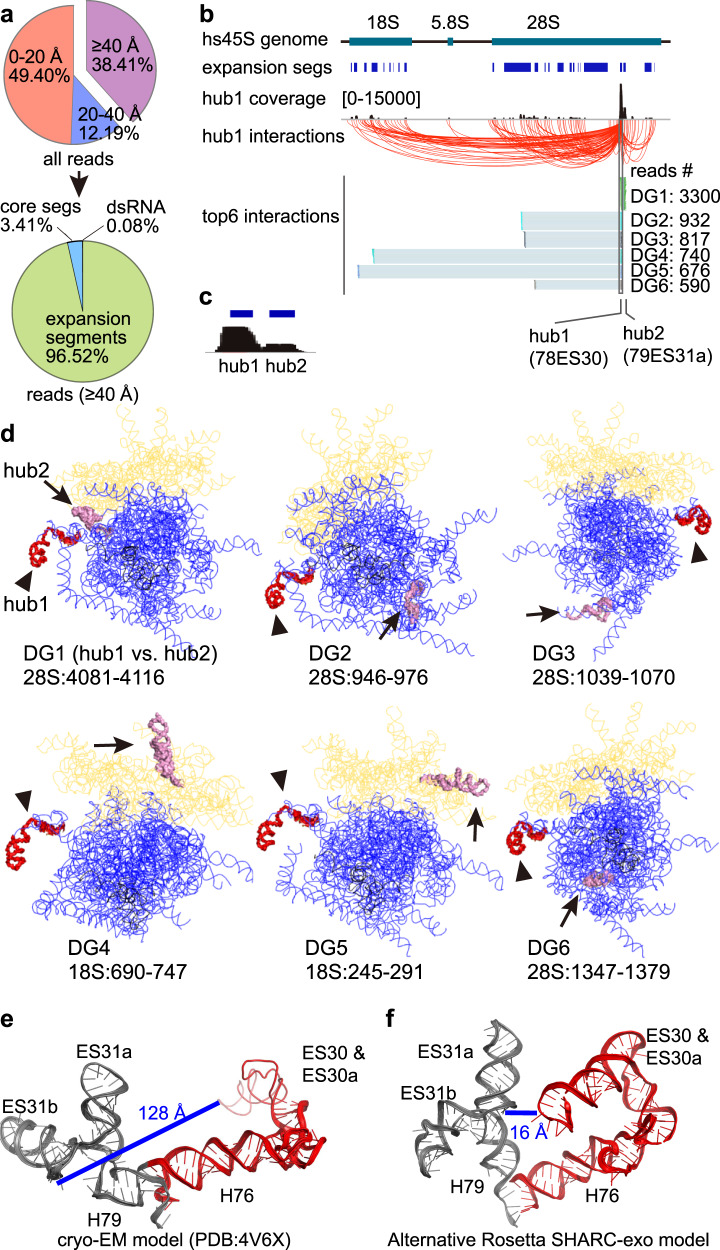
Fig. 5. SHARC-exo reveals dynamic conformations of expansion segments in the ribosome.
a Distribution of reads based on their distances between the two arms. For reads with minimal distance >40 Å, the vast majority are mapped to the expansion segments (lower panel). b All hub1 interactions are shown by red arcs. Among top-ranked DGs connecting hub1, the highest abundance expansion segment (78ES30), 4 of them are within the 28S (DGs 1–3 and 6), and 2 of them with the 18S (DGs 4 and 5). c Zoom-in view of hub1 and hub2, the two most highly connected dynamic regions in the rRNAs. d Locations of the hub1 (red-colored, indicated by arrowheads) and its targets (gray, indicated by arrows). Blueline: 28S rRNA. Yellow line: 18S rRNA. Blackline: 5.8S rRNA. e, f Cryo-EM (e) and a representative Rosetta (f) model of the hub1-hub2 region (28S:3936–4175) in the ribosome. Distances are between the 2′OH groups at nucleotides 4000 and 4123. f The Rosetta model was constructed with a single constraint between nucleotides 4000 and 4123. Source data are provided as a Source Data file.

