Figure 5.
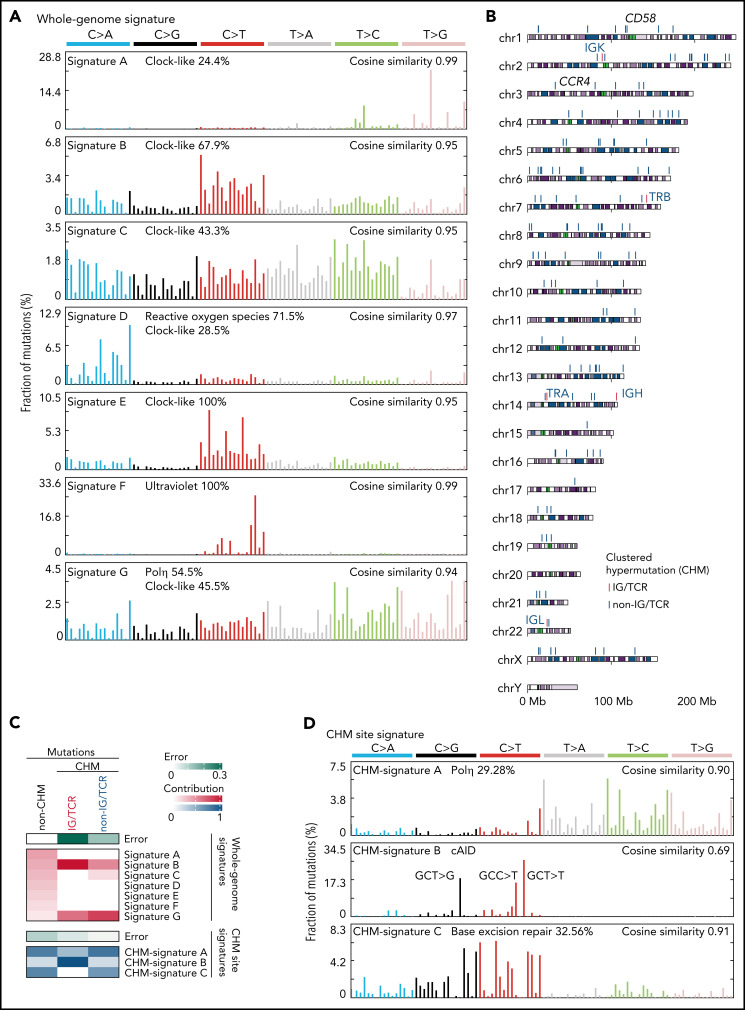
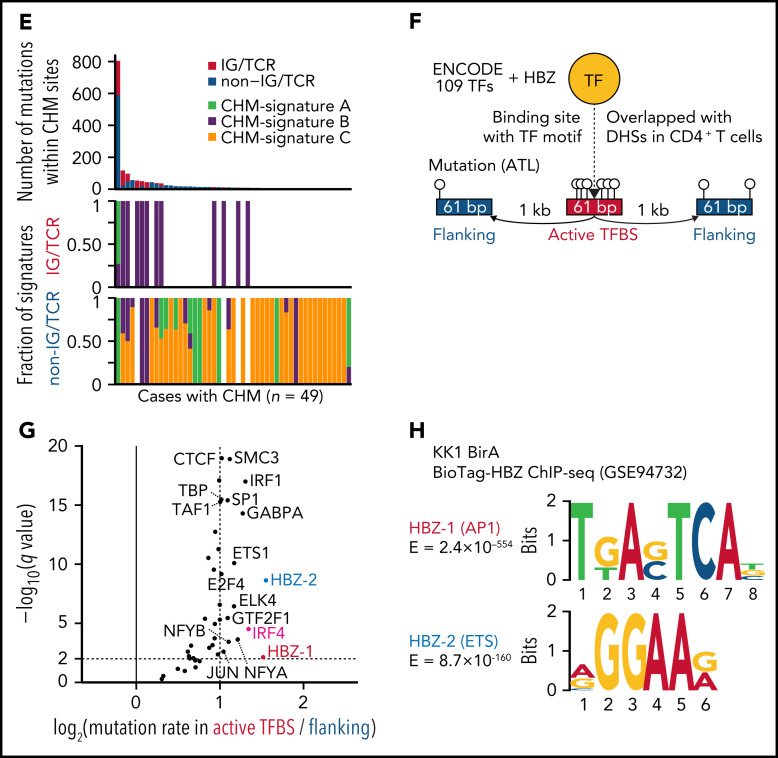
Mutational processes operative in ATL. (A) Seven de novo mutational signatures extracted from the whole-genome mutations. Known related etiologies are noted. Cosine similarities between de novo signatures and reconstructed signatures using the COSMIC database40are shown. (B) Distribution of CHM sites detected by SeqKat. Driver, IG, and TCR genes are noted. (C) Heatmap showing the relative contribution of whole-genome (Signature A-G), and CHM-specific signatures (CHM-signature A-C) across the CHMs within and outside the IG/TCR regions (CHM IG/TCR and CHM non-IG/TCR, respectively) and the remaining mutations (non-CHM). (D) Three de novo mutational signatures extracted from the CHM sites found in 49 ATL cases. (E) Number of mutations (top) and fraction of CHM signatures (bottom), stratified with the membership of the IG/TCR regions within CHM sites for each case. (F) Schematic representation for the analysis of mutation enrichment within active TF binding. (G) Volcano plot displaying differential mutation rate between active binding sites and its flanking regions for 40 TFs from ENCODE database48 and HBZ (with 2 motifs) in 150 ATL cases. Two-sided Fisher test with Benjamini-Hochberg correction. (H) Two HBZ motifs (AP1 and ETS) identified using MEME-ChIP (E < 1 × 10−150). DHSs, DNase I hypersensitive sites.


