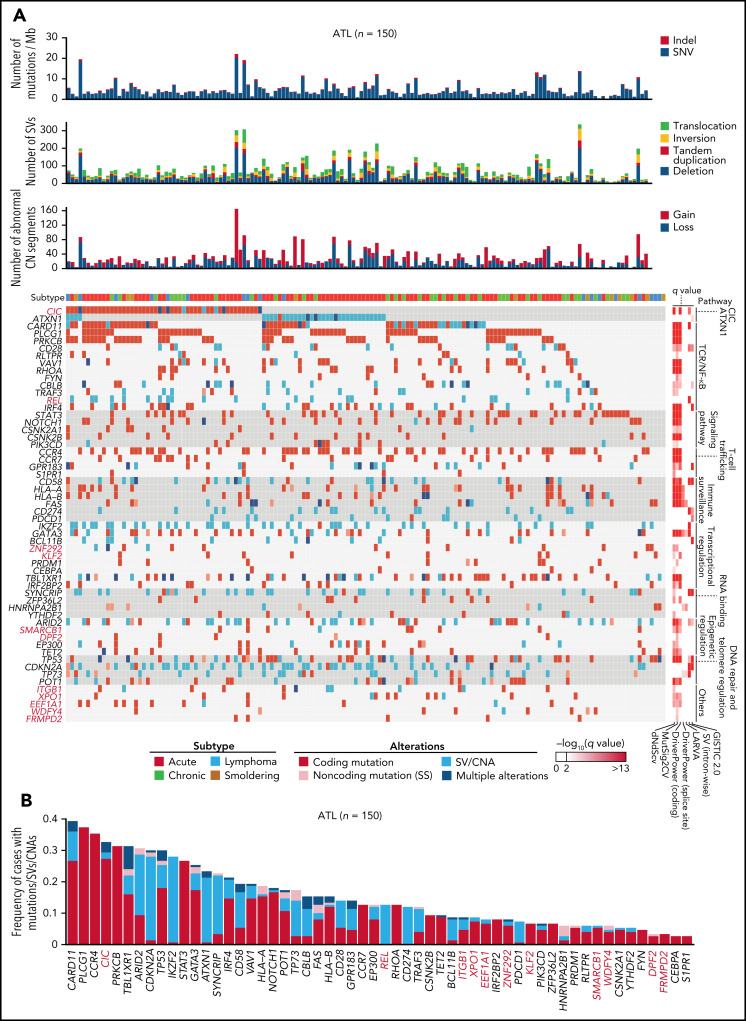
Figure 6.
Whole-genome landscape of driver alterations in ATL. (A) Significant somatic mutations, SVs, and focal CNAs in 56 commonly affected genes across ATL cases (n = 150). Number of somatic mutations, SVs, CNA segments, clinical subtypes (top), and q values from driver-calling algorithms and related functional pathways (right) are also shown. (B) Frequency and type of somatic mutations, SVs, and focal CNAs in 56 driver genes for 150 ATL cases. (A-B) Newly detected driver genes in ATL are highlighted in red (n = 11).

