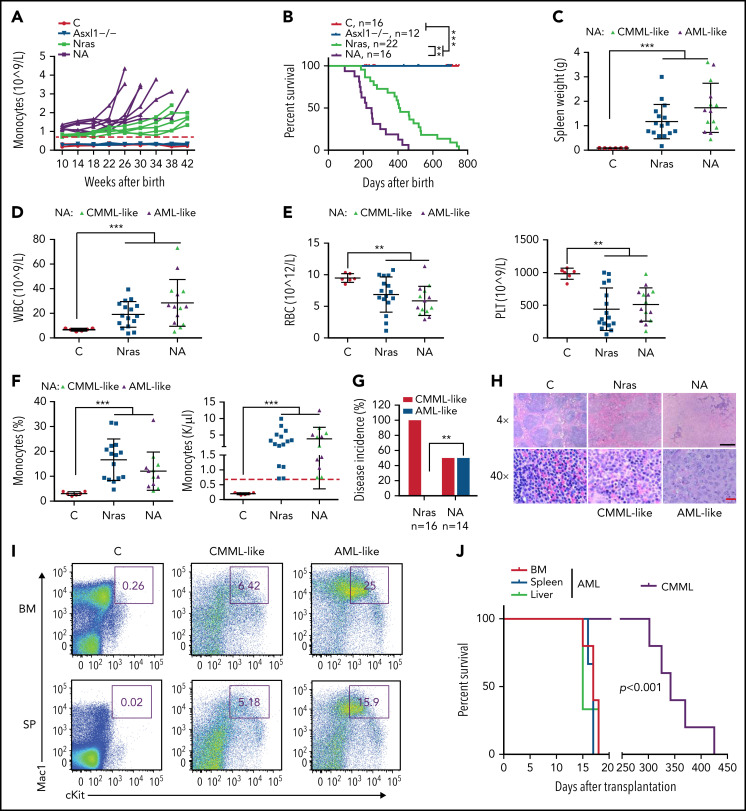
Figure 3.
Asxl1−/− co-operates with NrasG12D/+ to promote CMML progression and AML transformation. (A) The absolute numbers of monocytes in peripheral blood of control (Vav-Cre), Asxl1−/−, Nras, and NA mice were monitored regularly. Monocytosis (red dash line) is defined as threefold over the average number of control monocytes. (B) Kaplan-Meier survival curves were plotted against days after birth. P values were determined using the log-rank test. (C-I) Moribund Nras and NA mice and age-matched control mice were analyzed. (C-F) Quantification of (C) spleen weight, (D) numbers of WBCs, (E) numbers of red blood cells (RBCs), and platelets (PLT), and (F) frequencies and numbers of monocytes in peripheral blood. Green triangles: NA mice with CMML; purple triangles, NA mice with AML. Red dashed line (F) indicates monocytosis as described above. (G) Quantification of disease incidence (χ2 analysis). (H) Representative spleen hematoxylin and eosin–stained sections from Control, Nras, and NA mice. Black scale bar, 500 μm; red scale bar, 20 μm. (I) Mac1 and c-Kit analysis of bone marrow and spleen cells from control and NA mice with CMML-like or AML-like disease. (J) Malignant cells from moribund NA mice with CMML-like or AML-like disease were transplanted into sublethally irradiated recipient mice (CD45.1+). Kaplan-Meier survival curves were plotted against days after transplantation. P values were determined using the log-rank test. Data are presented as mean + SD. *P < .05; **P < .01; ***P < .001.

