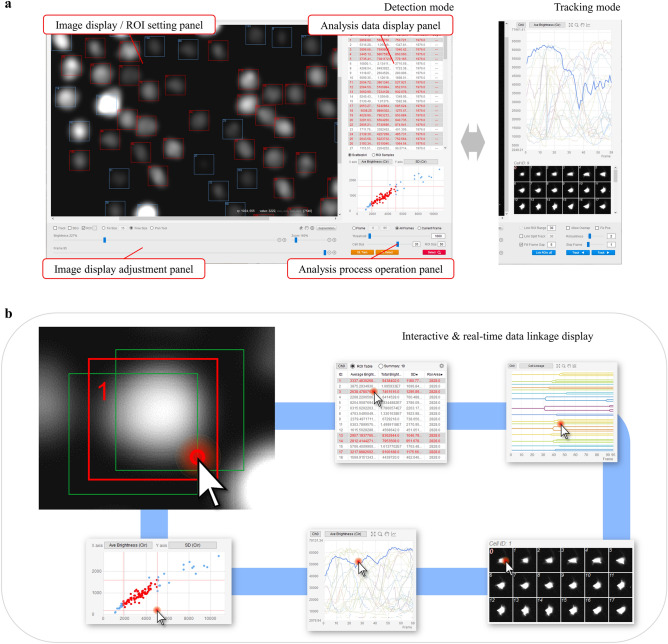
Figure 1.
LIM Tracker screen structure. (a) LIM Tracker screen structure. The screen is divided into detection mode and tracking mode, and tracking is performed by switching between them. The entire screen is divided into four panels, with image display and ROI setting functions (top left), analysis data display functions (top right), image display adjustment functions (bottom left), and analysis processing operation functions (bottom right) integrated into each panel. (b) The ROI and each data display item (list, graph, scatter plot, montage image, cell lineage) are linked, and the display is updated in real time when there is a change in the ROI status. Each item in the data display responds to mouse clicks, and all data related to the selected item are instantly highlighted.

