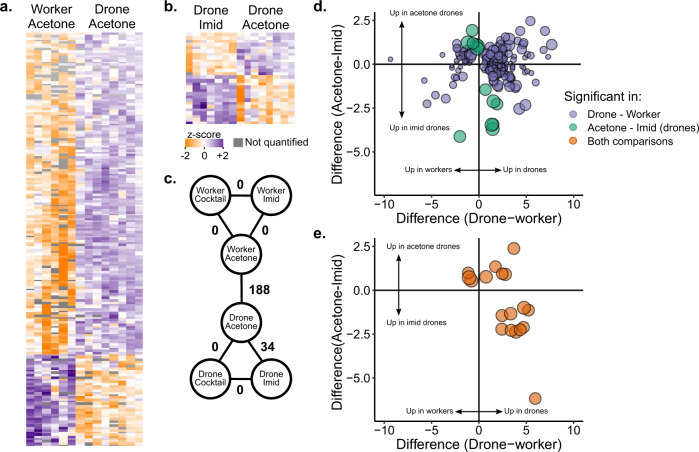
Fig. 3. Quantitative proteomics on surviving drone and worker hemolymph after topical exposure to pesticides.
Workers and drones exposed to the pesticide cocktail (2 µl of 10x solution in acetone, where x = the median concentration in wax), imidacloprid (2 µl of 1 ppm solution in acetone), and a negative control (2 µl of acetone). a Label-free quantitative proteomics results comparing negative control drones and workers. Each row is a protein and each column is a sample. Only significant differences (5% FDR, Benjamini Hochberg correction) are depicted. b Proteins differentially expressed between imidacloprid-exposed drones and controls. c Summary of statistical analyses comparing different groups. Numbers indicate the number of proteins differentially expressed at 5% FDR. d Summary of significance and direction of change in expression for proteins differentially expressed in drones vs. workers (purple), and imidacloprid vs. control drones (green). Circle size is proportional to −log(p value) for the drone imidacloprid vs. acetone comparison. e Proteins differentially expressed in both statistical comparisons. Circle size is proportional to −log(p value) for the drone imidacloprid vs. acetone comparison. Underlying data can be found in Supplementary Data 4, and summary statistics of these data are in Supplementary Data 5.

