
Fig. 3. Correlation between the clinical blood markers and the differentially expressed plasma proteins.
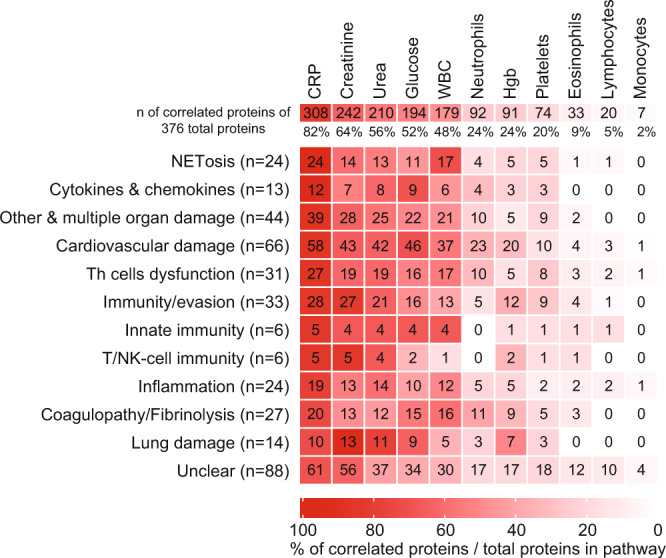
The correlation between the expression of the 375 differentially expressed plasma proteins and the available blood markers and blood cell counts in our cohort was evaluated. The overall number (and the percentage) of the DEPs which correlated (significance of p < 0.05, two-tailed, using Pearson’s correlation, GraphPad Prism) with each clinical measurement are shown in the top row. The heatmap shows the number of DEPs (and the percentage depicted by the heatmap colors), which correlated with each clinical parameter stratified by the functional annotations shown in Fig. 2. CRP showed the highest number of overall and function-specific correlations with the DEPs.