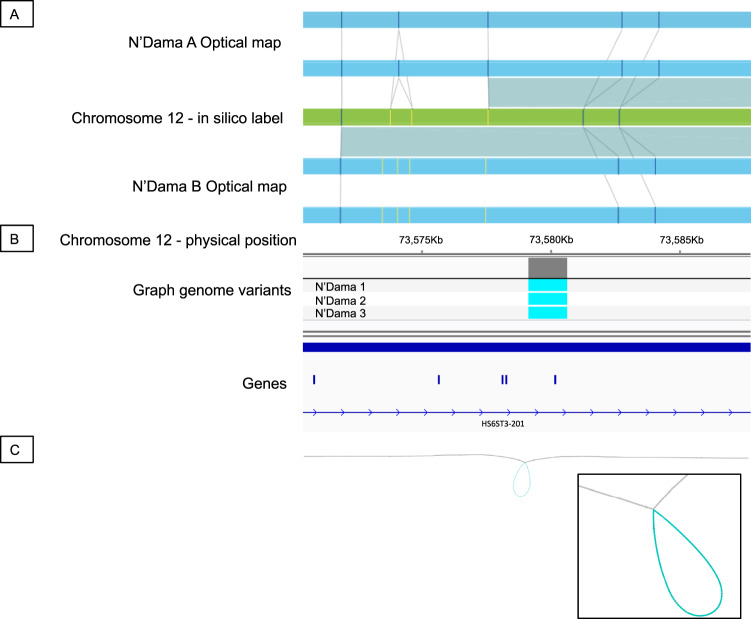
Fig. 5. Example of an insertion in the N’Dama relative to the Hereford reference.
The insertion was detected A in both Kenyan N’Dama OM samples as represented by an increase in the distance between labels (vertical lines) on each bionano haplotype (blue rectangles) over that expected given the labels’ in silico locations in the Hereford reference (green rectangle). B This SV was identified as homozygous in all three Nigerian N’Dama resequenced genomes when called against the graph genome. C A Bandage76 representation of the graph genome in this region showing the large structural variant (blue loop) in the Hereford genome (grey line).

