Figure 1.
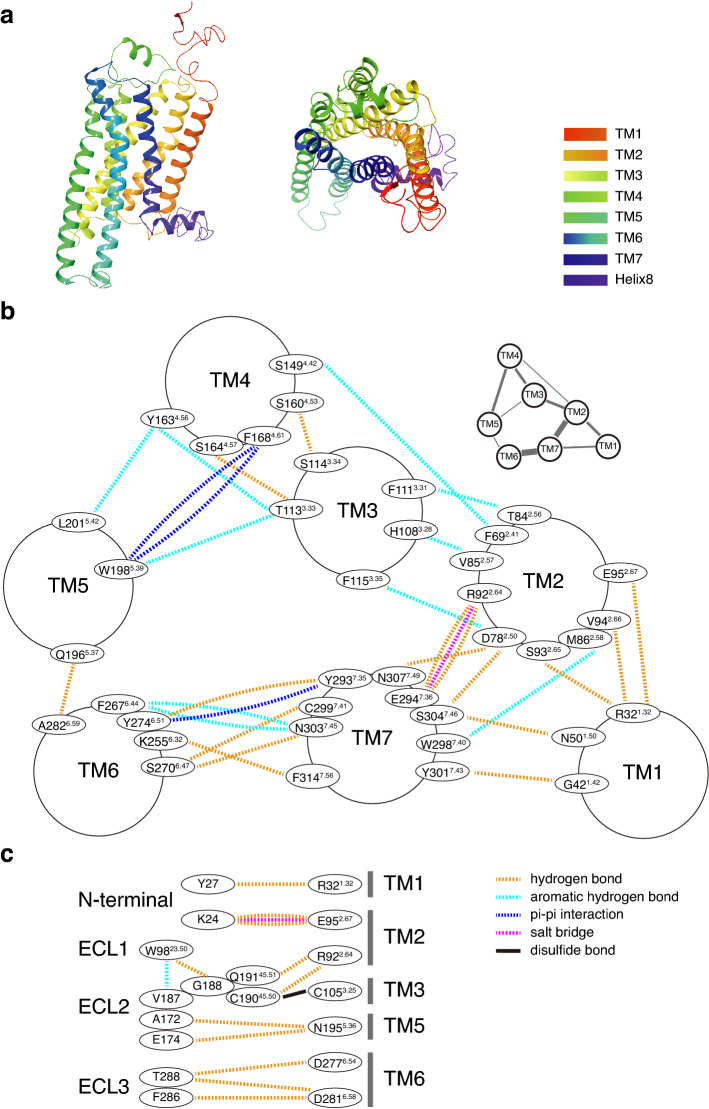
Homology modeling of TAAR9 predicts the intra-receptor interactions. (a) Homology modeling of mTAAR9 shows typical 7 transmembrane domains (colored according to residue position). Left: Side view. Right: Extracellular view. (b) Detailed inter-helical non-covalent interactions in TAAR9 from extracellular side view. Residue numbers were assigned following numbering scheme in GPCRdb12. Dotted lines represent presence of inter-helical interactions. Those interactions are mainly composed of hydrogen bonds (deep yellow) and aromatic-hydrogen bonds (cyan), with a few salt bridges (magenta) and pi-pi interactions (blue). An overview of inter-helical interactions network is shown in upper right, with thicker lines indicating stronger interactions. (c) Interactions between TM and N-terminal, TM and ECL, inter-ECL. Besides those interactions described in between TMs, disulfide bond (black lines) is observed between C19045.50 and C1053.25. Only residues in TM1, 2, 3, 5, 6 show interaction with extracellular domains.

