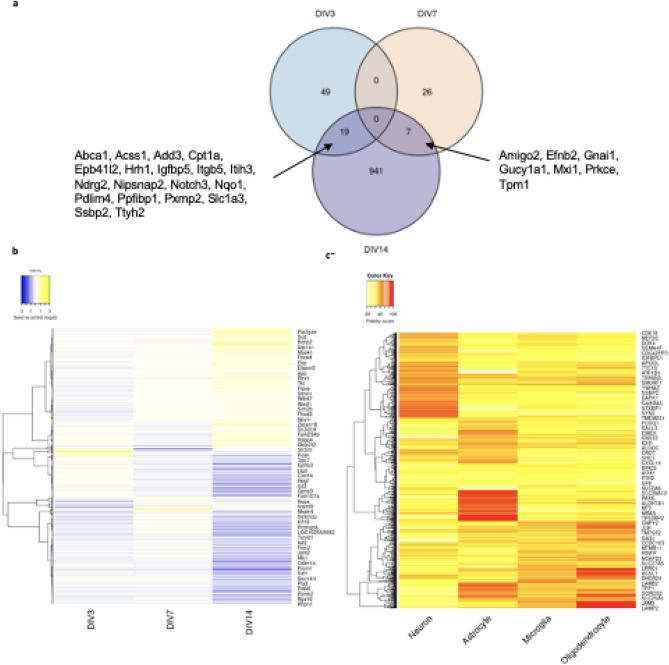
Figure 2.
Analysis of the 1075 significantly differentially expressed genes from differential expression analysis. (a) Venn diagram showing the overlap of significant genes identified at DIV3, DIV7 and DIV14. (b) Heatmap of differentially expressed genes between seed and control at timepoints DIV 3, DIV 7 and DIV 14. Row clustering was applied based on Pearson correlation between genes. Underlying data to generate plot can be found in Supplementary File 2. (c) Heatmap of fidelity scores from Cell Type Correlates Oldham Lab22–24 for cell type specific expression of differentially expressed genes. Row clustering was applied based on Euclidean distance between genes.

