FIGURE 4.

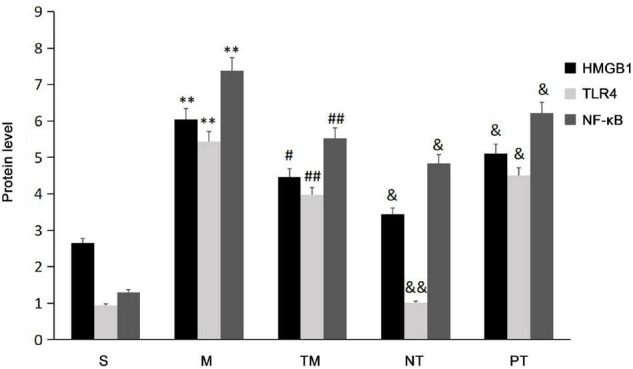
The positive signal areas in the different groups (n = 10). *P < 0.05, **P < 0.01: compared with the S group; #P < 0.05, ## < 0.01: compared with the M group; &P < 0.05, &&P < 0.01: compared with the TM group.

The positive signal areas in the different groups (n = 10). *P < 0.05, **P < 0.01: compared with the S group; #P < 0.05, ## < 0.01: compared with the M group; &P < 0.05, &&P < 0.01: compared with the TM group.