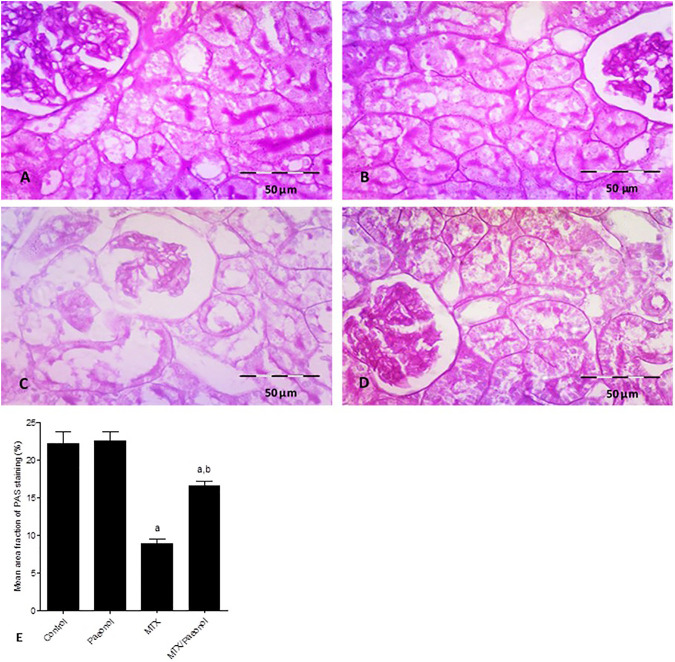
FIGURE 2.
Histopathological picture of the kidney after methotrexate (MTX) and/or paeonol administration stained by periodic acid–Schiff (PAS). A photomicrograph of the rat kidney (×400) obtained from (A) control, (B) paeonol-treated, (C) MTX-treated, and (D) MTX/paeonol-treated rats. (E) Percent of mean area fraction of PAS staining obtained from sections of each animal (n = 6 for each group), six fields/section, where results were considered significantly different when p < .05. a,b Significant difference compared to control or MTX groups, respectively.

