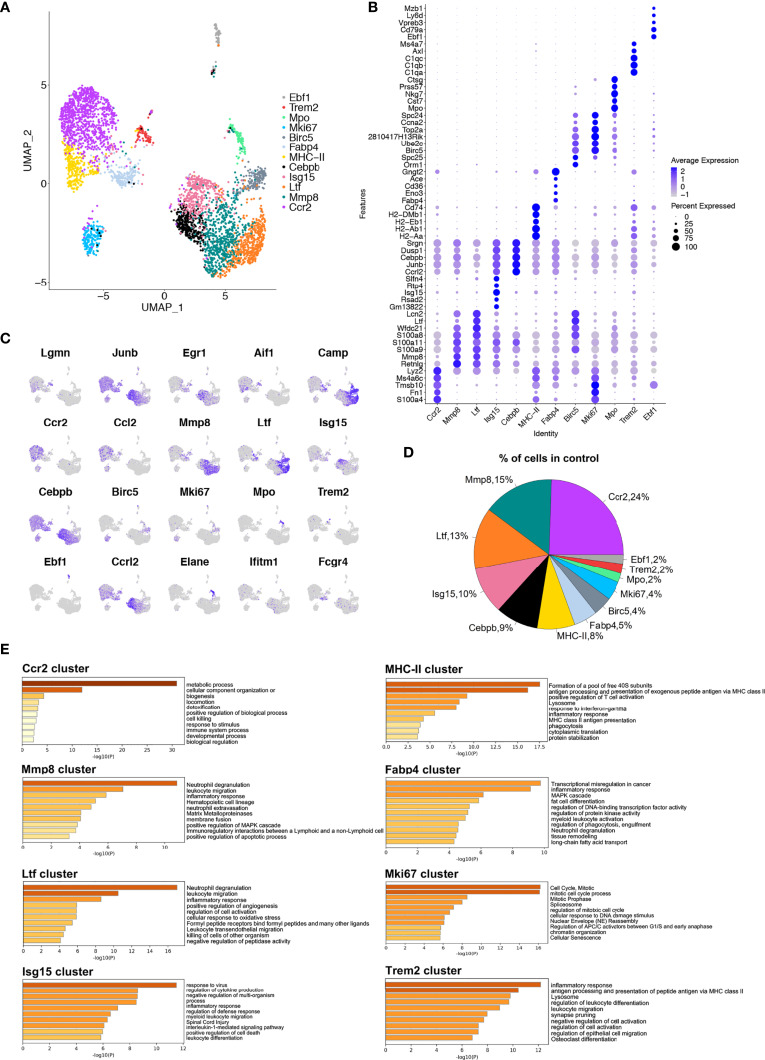
Figure 2.
Single-cell analyses show macrophage subsets in murine alveolar bone. (A) UMAP plot of cells in control group. 12 (0 to 11) clusters were identified. Dimensional reduction was performed with principal component analysis (PCA) and visualization using UMAP plots. (B) Dot plot of differentially expressed genes in each cluster. (C) Feature plots depicting single-cell gene expression of individual genes. (D) Proportions of 12 different macrophage clusters. (E) The top 60-65 markers (adj. p-value < 0.05) per cluster were used to identify the functional enrichment categories using Metascape. Pathway enrichment is expressed as the -log10(P) adjusted for multiple comparison.

