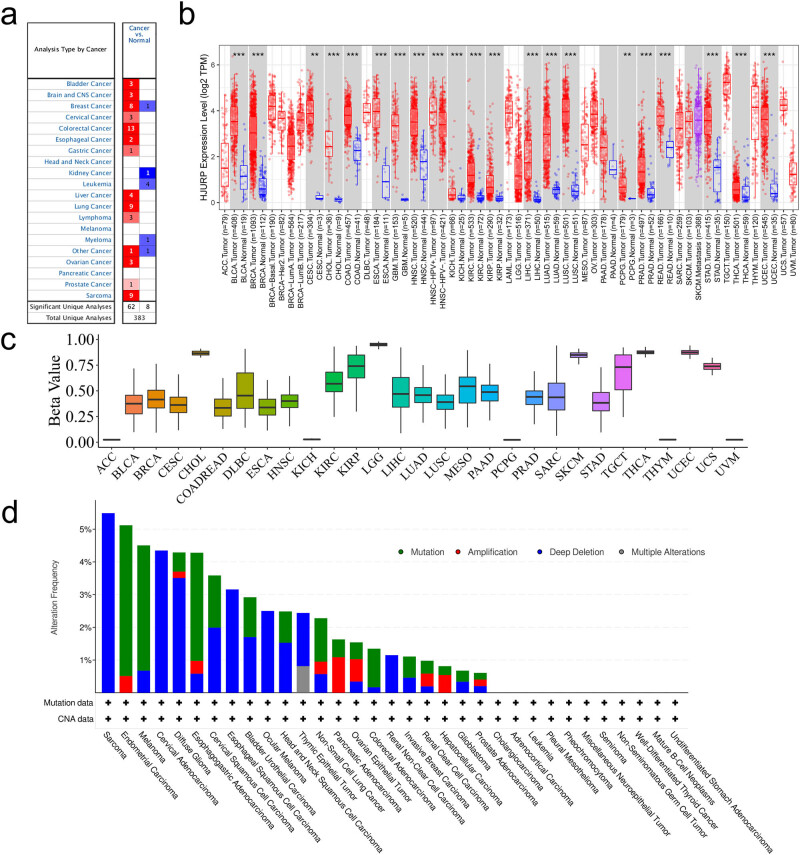
Figure 1.
HJURP expression and mutation landscape: (a) In the ONCOMINE database, the expression of HJURP in tumor tissues compared with normal tissues. The number in each unit is the number of data sets. Red means that the tumor is significantly high in tumor tissues; blue is the opposite. (b) The expression level of HJURP of different tumor types in the TIMER database. (c) Boxplot of the methylation levels. (d) HJURP (single mutation) mutation and copy number aberrations in all TCGA cohorts.

