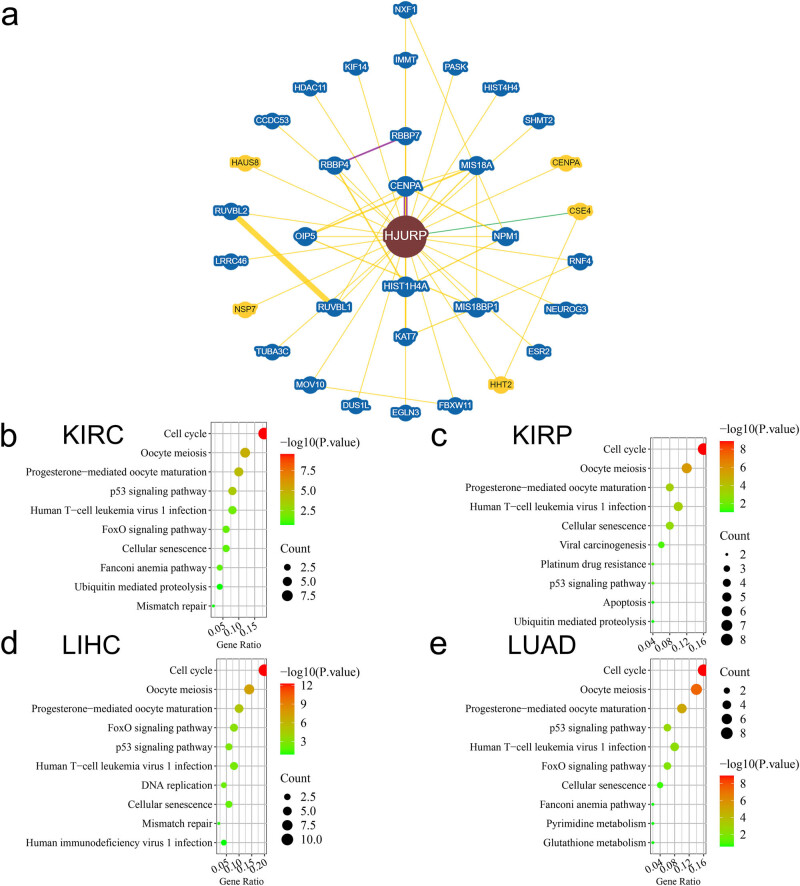
Figure 4.
Integrated network and pathway analysis of HJURP: (a) The integrated network of HJURP. Yellow means the line is based on physical interactions. Green means the line is generated from genetic interaction. Purple means colocalization. Node size stands for its weight in the network. (b–e) Pathway enrichment of top 50 genes with the highest expression similarity to HJURP in different tumor types.

