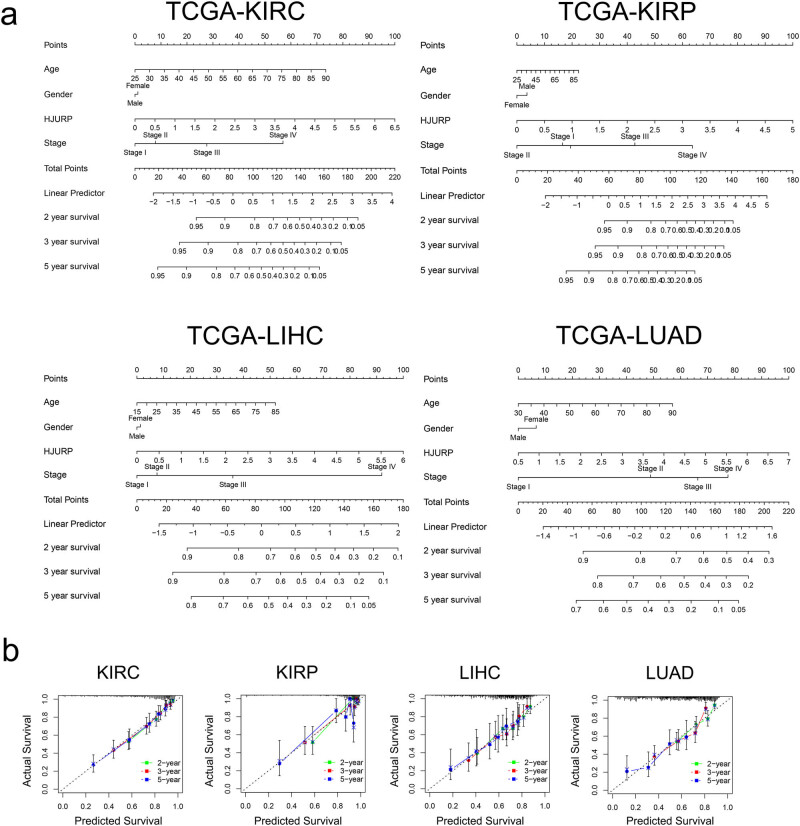
Figure 5.
Nomogram construction and validation: (a) Nomogram for predicting 2, 3, and 5 year OS for different cancer patients based on expression of HJURP and clinicopathological parameters. (b) Calibration curves of nomograms in terms of agreement between predicted and observed 2, 3, and 5 year outcomes in TCGA cohort. The dashed line of 45° represents perfect prediction, and the actual performances of our nomogram are shown by green, red, and blue lines.

