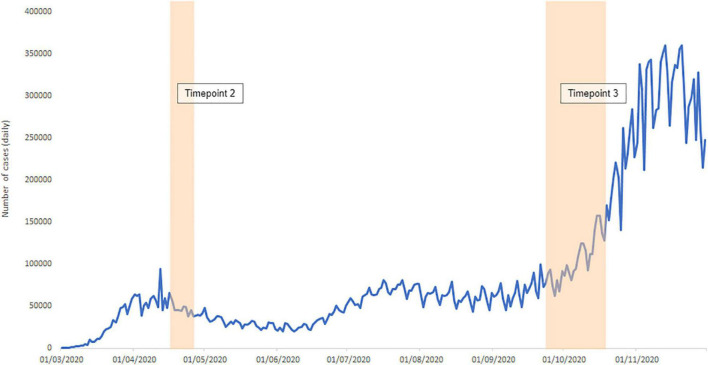
FIGURE 1.
Timeline showing data collection intervals during the pandemic in the context of daily case rate (sum across sample countries-of-residence). Vertical shaded blocks represent data collection periods in 17th–26th April 2020 (timepoint 2) and 25th September–19th October 2020 (timepoint 3). Note that at timepoint 2, national or localised lockdowns were in place in the United Kingdom (60.2% of sample) and the majority of other countries-of-residence sampled. Two participants were resident in Hungary where localised recommendations were in place rather than lockdowns. At timepoint 3, all countries sampled were not in national lockdowns. COVID-19 data taken from COVID-19 Data Repository by the Center for Systems Science and Engineering (CSSE) at Johns Hopkins University. Cases are daily new confirmed cases of COVID-19 summed across the countries-of-residence sampled.

