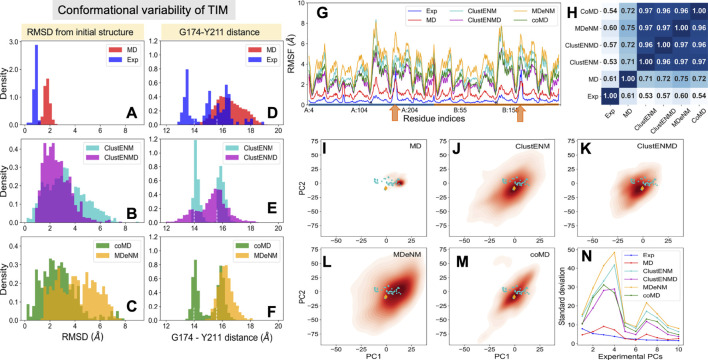
FIGURE 4.
Comparison of the ensembles of conformers experimentally observed and computationally generated for TIM. The panels are in the same format as Figure 2. (A–C) RMSD histograms with respect to the starting apo structure (PDB id: 1tcd). (D–F) Distances between α-carbons of G174 and Y211 that monitors the opening-closing of the catalytic loop. Dashed lines indicate the loop distances in the different subunits of starting dimeric structure. (G) RMSFs with respect to the initial structure for each ensemble. Orange arrows indicate the catalytic loop position in each subunit. (H) Pearson correlation coefficients between pairs of RMSF profiles. (I–M) Population distributions of computed ensembles (labeled in each panel) projected onto subspace spanned by ePC1 and ePC2. (N) Standard deviations of the conformers projected along ePCs.

