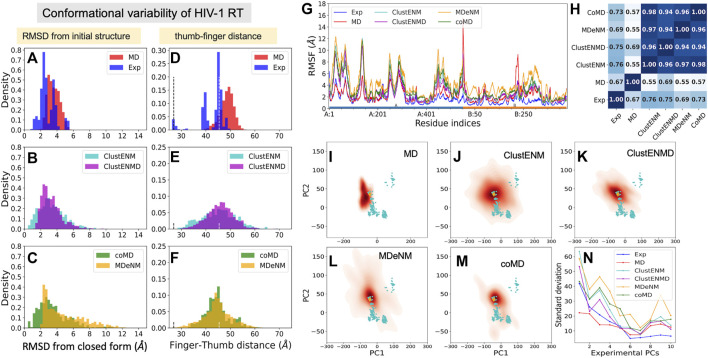
FIGURE 8.
Comparison of computational and experimental ensembles of HIV-1 RT. (A–C) RMSDs with respect to the starting closed ligand-free structure (PDB id: 3kli). (D–F) Distances between the centers of mass of the fingers (residues 1–85 to 112–155) and thumb (residues 242–312) subdomains on the p66 subunit (chain A) that describe open-to-closed fluctuations of the two subdomains. Dashed lines indicate the distances in the open and closed reference structures (PDB id: 2b6a and 3kli, respectively). (G) RMSFs for each ensemble. The bars underneath indicate the p66 subunit (chain A; blue) and the p51 subunit (chain B; orange). (H) Pearson correlation coefficients between pairs of RMSF profiles. (I–M) Population distributions for ensembles generated by (I) MD, (J) ClustENM, (K) ClustENMD, (L) MDeNM, and (M) coMD. (N) Standard deviations of the conformers projected along the experimental PCs.

