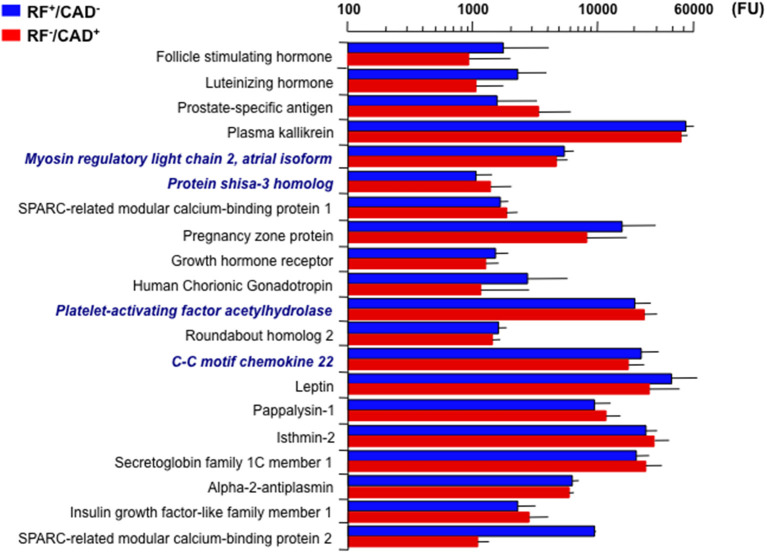
Figure 1.
Twenty top plasma signals associated with the outlier groups (CAD+/RF− and CAD−/RF+). Signals are in fluorescence units (FU). Bars are mean ± standard deviation. Bold italics indicate the four proteins that remained significantly different between the two groups after adjusting for gender and age. CAD, coronary artery disease; RF, risk factor.

