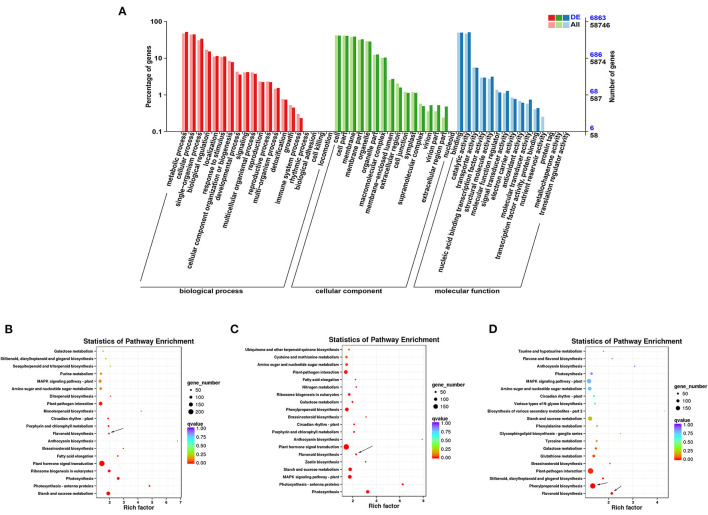
Figure 4.
Functional annotation of DEGs in ZBLs under drought stress. (A): Gene ontology (GO) annotation of DEGs in FJ and HJ under drought stress. (B–D): KEGG enrichment analysis of DEGs in F1 vs. F4, H1 vs. H4, and F4 vs. H4. Dot size represents the number of distinct genes, and dot color reflects the q-value.

