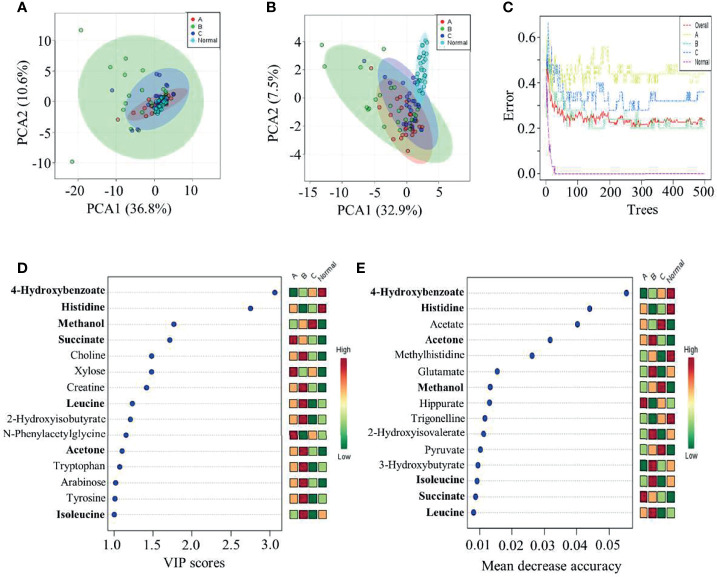
Figure 3.
Statistical comparison among the four clinical groups. (A) PCA, (B, D) PLS-DA, and (C, E) random forest tests were performed to identify group characteristics and potential metabolite biomarkers along with CRC treatment. Group A, CRC patients before surgery; Group B, CRC patients after surgery; Group C, CRC patients after chemotherapy; and Group N, healthy control group.

