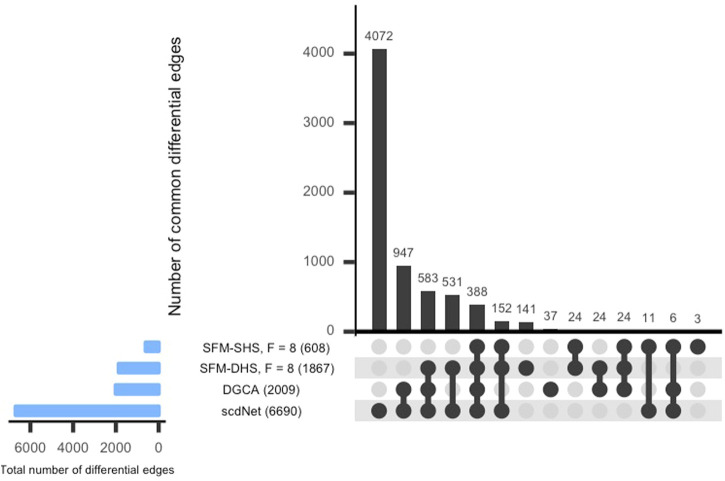
FIGURE 4.
UpSet plot of the number of differential edges determined by four differential network methods in the SARS-CoV-2 case study dataset. The numbers in parentheses represent the total number of differential edges detected by the corresponding method. Results displayed for SFM-SHS and SFM-DHS are from the bootstrap estimation procedure.

