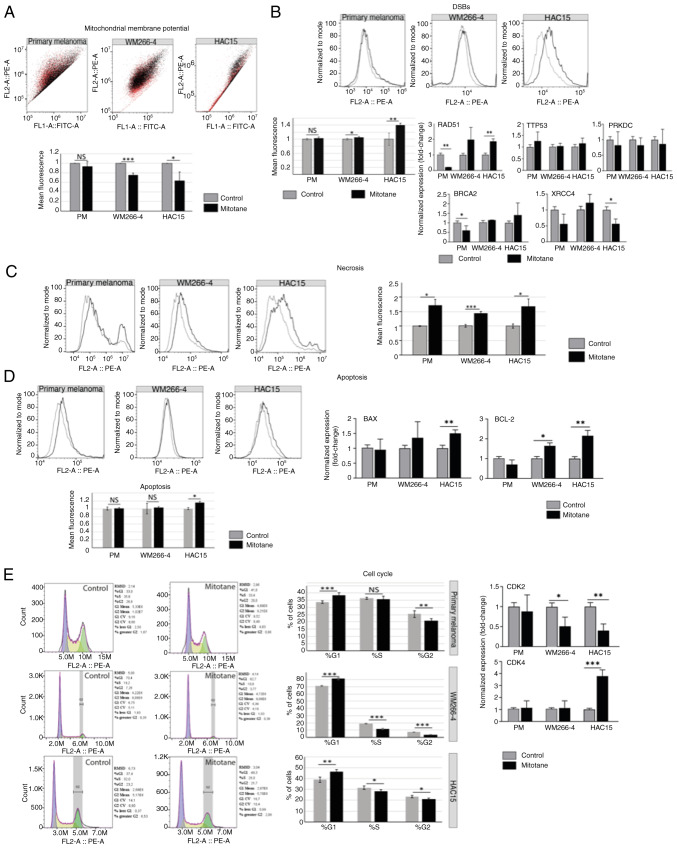
Figure 2.
Effect of mitotane on mitochondrial membrane potential. (A) The black and red colors reflect the changes shown in the chart below, where the black color corresponds to the untreated control and the red color indicates changes in red fluorescence after mitotane treatment. In the WM266-4 and HAC15 cell lines, significant changes in red fluorescence were observed (P<0.001 and P<0.05, respectively). By contrast, primary melanoma cells showed no significant changes in fluorescence intensity. (B) The most significant change in DSBs (as reflected γH2AX expression) was observed in the HAC15 cell line (~40% increase; P<0.01). The WM266-4 cell line also showed a notable increase in DSBs formation (~10%; P<0.05). Primary melanoma cells showed no significant change in the number of DSBs. Analysis of the expression of genes involved in DNA damage response showed that the HAC15 cell line may promote homologous recombination (RAD51, ~1.85 fold-change). Primary melanoma cells showed decreased gene expression of BRCA2 (~0.6 fold-change) and RAD51 (~0.2 fold-change). No significant changes in gene expression of TTP53 or PRKDC were observed in any of the cell types evaluated. (C) In all the investigated cell types, an elevated level of necrosis was observed: ~72% (primary melanoma), ~44% (WM266-4) and ~60% (HAC15). (D) Apoptosis was analyzed via flow cytometry detecting cleaved PARP-1. The HAC15 cell line presented significantly higher levels of pro-apoptotic markers (BAX) and antiapoptotic markers (BCL-2) compared with those of other cell types. Specifically, BAX and BCL-2 gene expression was significantly increased in HAC15 cells (~1.5 and ~2.16 fold-change, respectively). The WM266-4 cell line also showed an elevated level of BCL-2 gene expression (~1.61 fold-change; P<0.05). (E) All the investigated cell types (primary melanoma, WM266-4 and HAC15) showed a higher percentage of cells in the G1 phase of the cell cycle, as follows: From ~33.72 to ~38.53% in primary melanoma cells; from ~71.22 to ~81.15% in WM266-4 cells; and from ~38.95 to ~46.40% in HAC15 cells. The CDK2 and CDK4 genes showed, respectively, decreased and increased expression levels. The most notable changes were observed in the HAC15 and WM266-4 cell lines [CDK2, ~0.4 fold-change (HAC15) and ~0.5 fold-change (WM266-4); and CDK4, ~3.8 fold-change (HAC15)]. Primary melanoma cells did not show a significant change in the expression of these genes. *P<0.05, **P<0.01, ***P<0.001. DSB, DNA double-strand breaks; RAD51, RAD51 recombinase; BRCA2, breast cancer type 2 susceptibility protein; PRKDC, protein kinase, DNA-activated, catalytic subunit; PM, primary melanoma.

