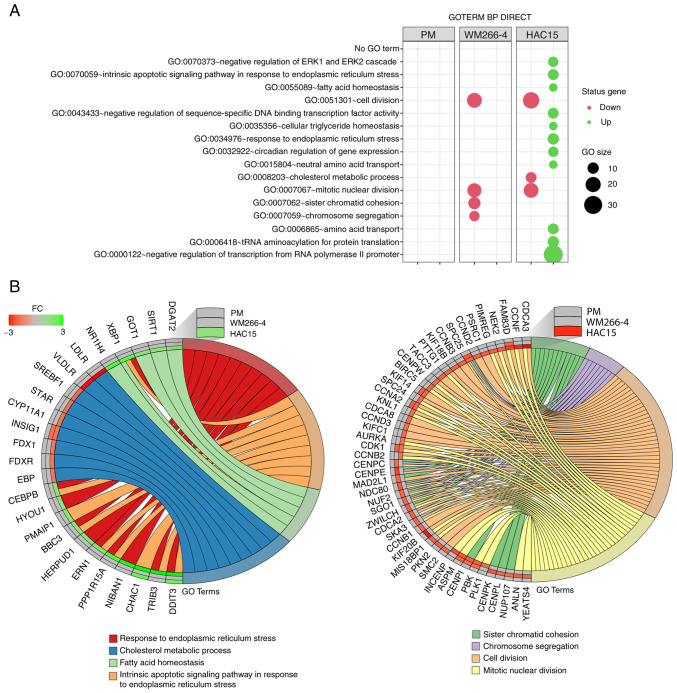
Figure 4.
(A) Bubble plot of DEG sets overrepresented in the DAVID GO-BP DIRECT database. The graph shows only the GO terms above the established cut-off criteria (corrected P<0.05 and >5 genes per group). Each bubble's size reflects the number of DEGs assigned to the GO-BP terms. The bubble's transparency displays P-values (more transparent indicates closer to the P=0.05 cut-off value). The red color indicates downregulated expression of the genes comprising the relevant GO term, while the green color indicates upregulation of such genes. (B) Detailed analysis of eight enriched gene ontological groups selected from the DAVID GO-BP DIRECT GO database, presented as Circos plots. Symbols of DEGs are presented on the left side of the graph with their fold-change values, mapped by color scale, where green indicates higher expression, red indicates lower expression and grey indicates expression levels below the cut-off value for a given cell type. Colored connecting lines determine gene involvement in the GO terms. GO, Gene Ontology; DAVID, Database for Annotation, Visualization and Integrated Discovery; BP, biological process; DEG, differentially expressed gene; PM, primary melanoma; FC, fold-change.

