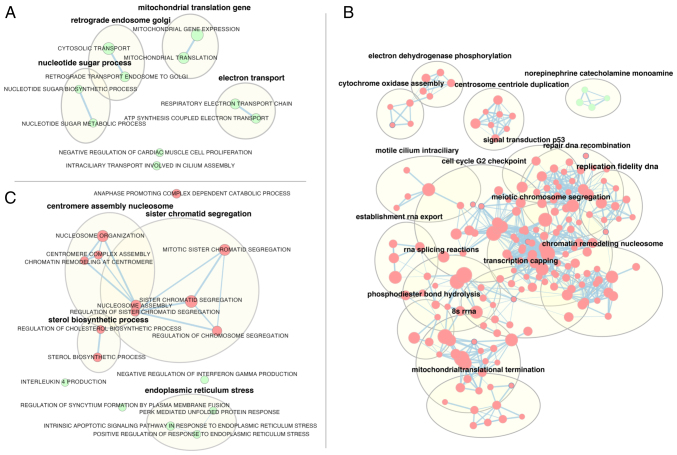
Figure 5.
Gene set enrichment analysis of (A) primary human melanoma cells, (B) WM266-4, human melanoma cell line and (C) HAC15 human adrenal carcinoma cell line after a 24-h incubation with mitotane (50 µM) compared with that of control (untreated) cells. The diagram shows the enrichment map of significantly changed terms (green indicates increased while read indicates reduced; adjusted P<0.05). The thickness of the connecting line indicates the level of genes matching to individual terms.

