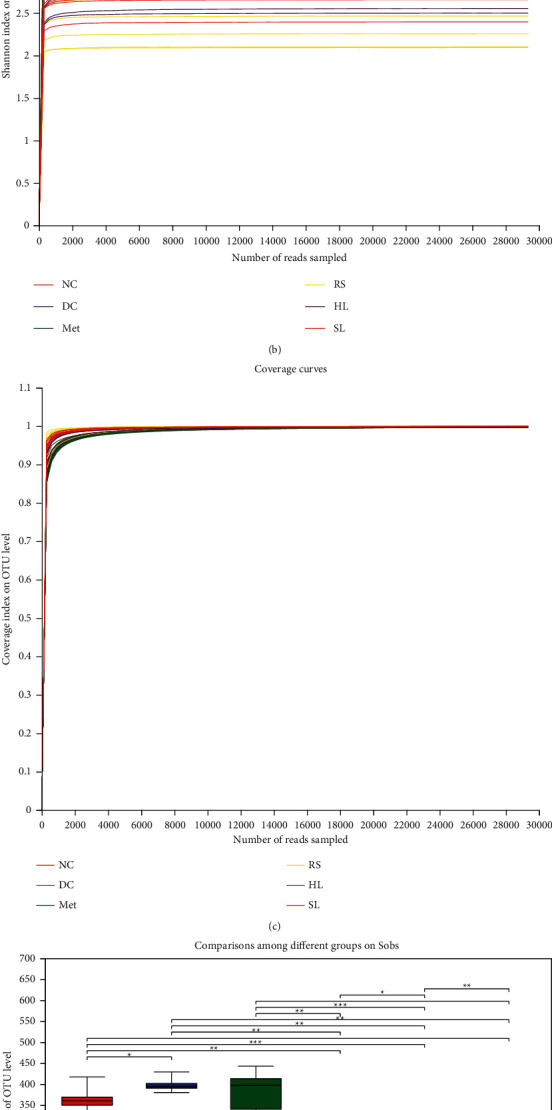
Figure 2.

Alpha diversity analysis of bacterial relative abundances. (a) Sobs, (b) Shannon, and (c) coverage diversity curves of gut microbiota community, which reflect the richness, diversity, and coverage of the community, respectively. Comparisons among different groups on (d) Sobs and (e) Shannon of gut microbiota were significant. ∗P < 0.05; ∗∗P < 0.01.
