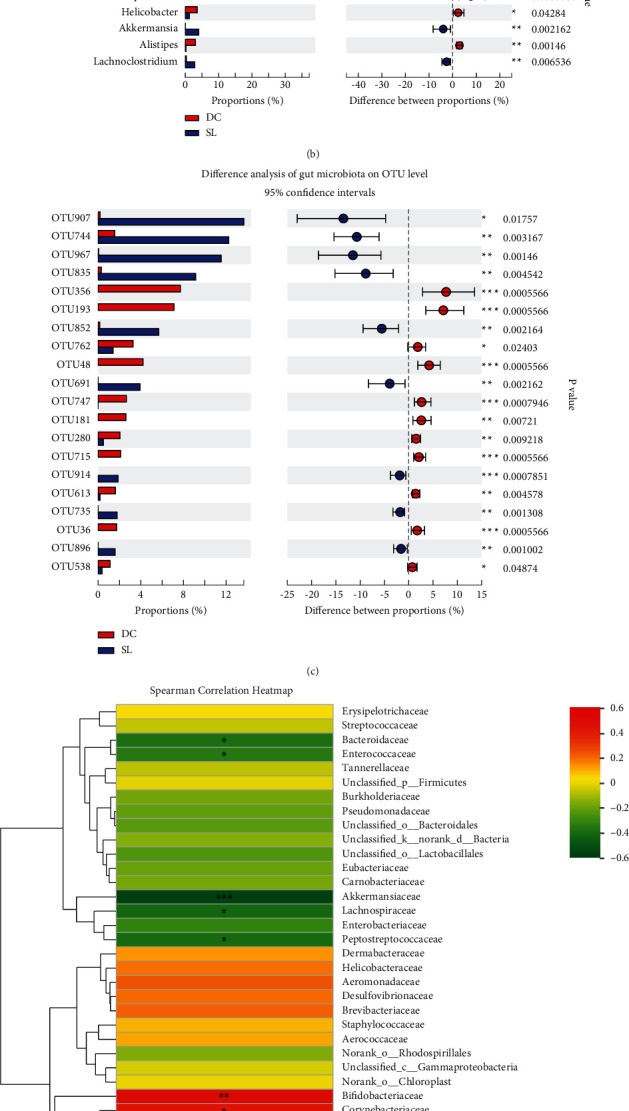
Figure 4.

Significantly different between DC and SL groups of gut microbial community at the (a) family level, (b) genus level, and (c) OTU level. ∗P < 0.05 and ∗∗P < 0.01, compared with the DC group. (d) Heatmap analysis indicating Spearman correlation between gut microbiota community and FBG on the family level, correlation R values, and P values were obtained by calculation; ∗P < 0.05 and ∗∗P < 0.01; R values were shown in different colors in the diagram.
