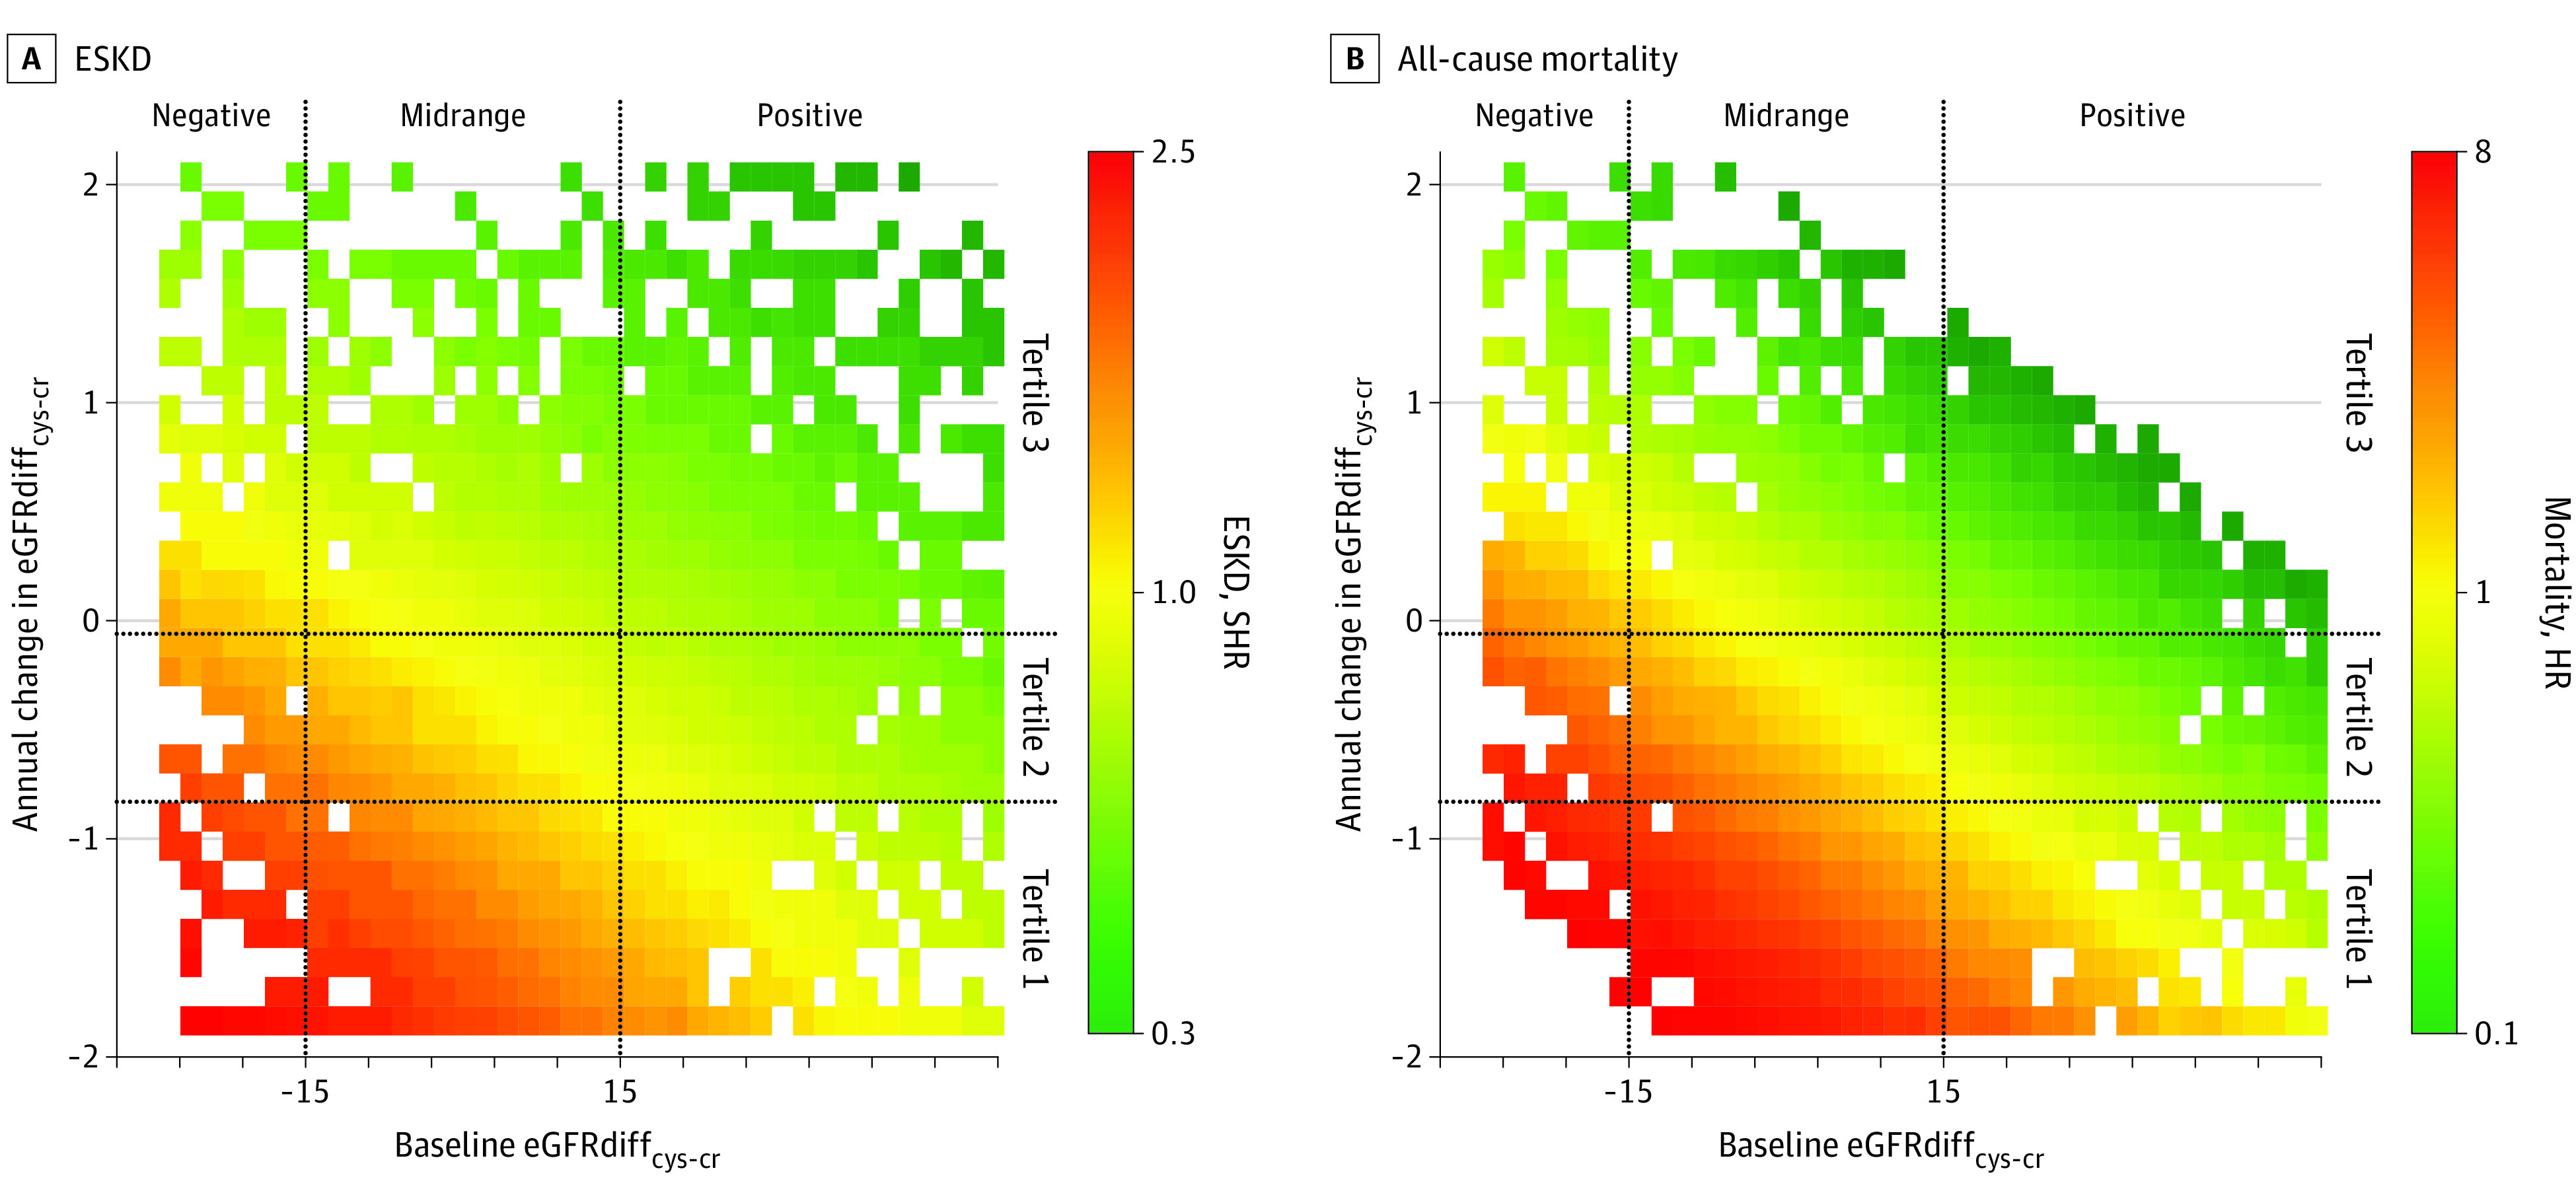
Figure 2. Heatmap of Unadjusted Associations of Baseline Difference in Creatinine- and Cystatin C–Based Estimated Glomerular Filtration Rate (eGFRdiffcys-cr).

ESKD indicates end-stage kidney disease; HR, hazard ratio; and SHR, subhazard ratio.

ESKD indicates end-stage kidney disease; HR, hazard ratio; and SHR, subhazard ratio.