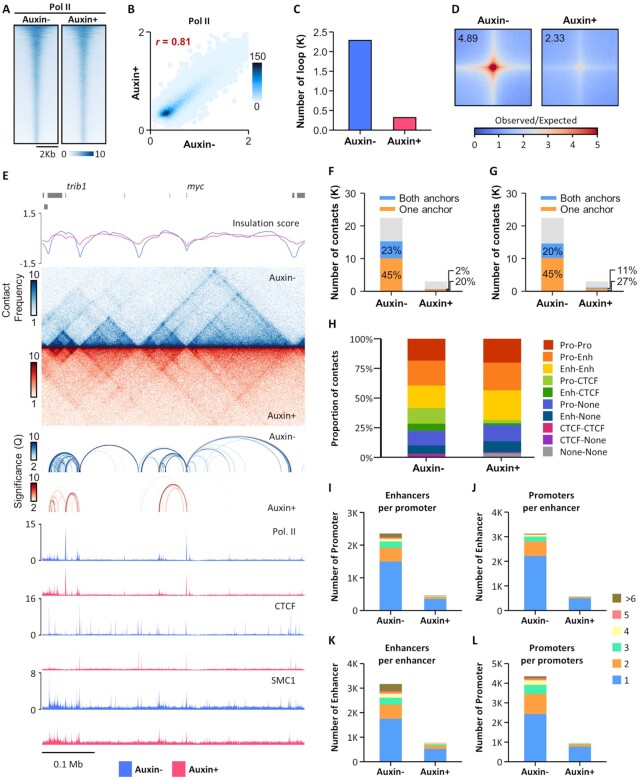
Figure 2.
Pol II-mediated chromatin interactions are greatly reduced by CTCF depletion. (A and B) Heatmaps (A) and scatterplots (B) of Pol II ChIP-Seq signals with or without auxin treatment. (C) Number of Pol II HiChIP loops with or without auxin treatment. (D) Aggregate peak analysis (APA) for Pol II HiChIP loops called from untreated cells, comparing Pol II HiChIP (top) or Hi-C (bottom) data generated from untreated (left) or auxin-treated (right) cells. (E) Snapshot of insulation score curves, Pol II HiChIP contact maps, Pol II HiChIP loops, and ChIP-seq signal tracks for Pol II, CTCF, and SMC1 with and without auxin treatment. (F and G) Percentage of overlap of CTCF (F) and SMC1 (G) ChIP-seq peaks with either one or both Pol II HiChIP loop anchors. (H) Distribution of regulatory elements at the anchors of Pol II HiChIP loops. (I) Number of enhancer-interacting promoters. (J) Number of promoter-interacting enhancers. (K) Number of promoter-interacting promoters. (L) Number of enhancer-interacting enhancers.

