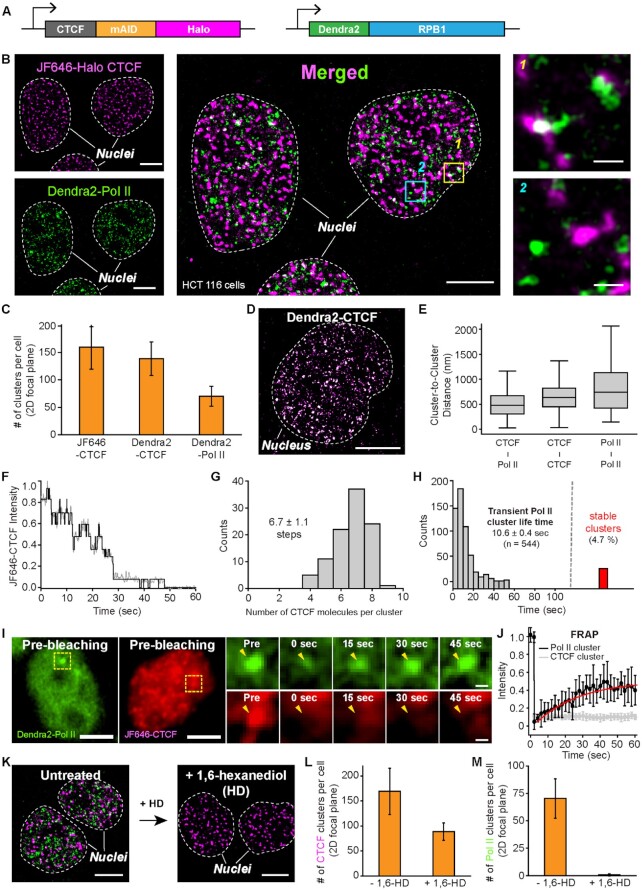
Figure 4.
Dual-color super-resolution imaging captures CTCF and Pol II clusters in a cell nucleus. (A) The mAID cassette, as well as HaloTag, are inserted at the C-terminus of CTCF on both alleles in a HCT116 cell line wherein Dendra2 is homozygously tagged to endogenous Pol II and the OsTIR1 gene is integrated at the AAVS1 locus. (B) Endogenous JF646-Halo-CTCF (left top, magenta) and Dendra2-Pol II (left bottom, green) form clusters in HCT116 nuclei. A super-resolved merged image shows both clusters in each nucleus (middle). Some CTCF and Pol II clusters were colocalized (right top), while others were not (right bottom). (C) Numbers of CTCF and Pol II clusters per cell per 2D focal plane for each cell line (from N = 20 cells for each). (D) A representative super-resolved image of Dendra2-CTCF clusters. (E) Center-to-center distance plots for nearby CTCF-Pol II, CTCF-CTCF, and Pol II-Pol II clusters, from N = 475, 1039 and 419 cluster pairs, respectively. (F) A representative intensity plot over time for photo-bleaching analysis to count numbers of CTCF molecules in a single CTCF cluster. (G) Distribution of CTCF molecules per cluster. N = 100 CTCF foci from nine cells were selected for the estimation. (H) Distribution of Pol II cluster life time (mean ± s.e.; n = number of clusters). 4.7% (red bar) of the clusters were temporally stable. (I) Representative images of FRAP experiments for CTCF and Pol II clusters. Yellow dotted boxes indicate specific photobleached regions. (J) Normalized fluorescence recovery for Dendra2-Pol II (black, N = 9 clusters) and JF646-CTCF (grey, N = 8 clusters). (K) Representative images for JF646-CTCF (magenta) and Dendra2-Pol II (green) before and after 1,6-hexanediol (1%, 10 min) treatment. (L and M) Number of CTCF and Pol II clusters per cell before (N = 20 cells) and after (N = 16 cells) 1,6-hexanediol treatment. Scale bars represent 5 μm for entire nuclei images and 500 nm for zoom-in images.

