Figure 8.
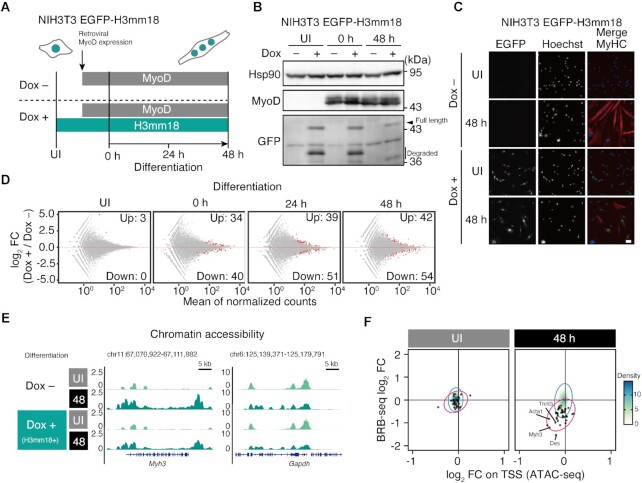
H3mm18 expression alters chromatin structures on myogenic gene loci during differentiation. (A) Schematic illustration of trans-differentiation experiments. NIH3T3 cells, expressing a doxycycline (Dox)-inducible EGFP-H3mm18 construct, were cultured with or without Dox for 24 h and subjected to retroviral infection-expressing MyoD. Differentiation was induced after 30 h of the retroviral infection. UI (UnInfected) indicates the time before retroviral infection, and 0, 24 and 48 h indicate the times after differentiation induction. (B) Immunoblot analysis of NIH3T3 EGFP-H3mm18 cells. (C) Immunocytochemistry (ICC) analysis of NIH3T3 EGFP-H3mm18 cells ectopically expressing MyoD. Cells at UI and 48 h were stained with an anti-MyHC antibody. DNA was counterstained with Hoechst 33342. Scale bar: 50 μm. (D) MA plots showing the time-series transcriptome profiles of the trans-differentiation experiments. (E) Representative genome browser images of ATAC-Seq at the Myh3 gene locus. (F) Time-series correlation analysis of the effects of transcriptome and open-chromatin profile alterations on H3mm18 expression. Fold changes of gene expression and ATAC peak signals on the TSS are plotted. Black dots indicate the 54 downregulated DEGs at 48 hours of differentiation. Red and blue ellipses indicate the 95% confidence intervals of the 54 DEGs in (D) and total genes, respectively.

