Figure 2:

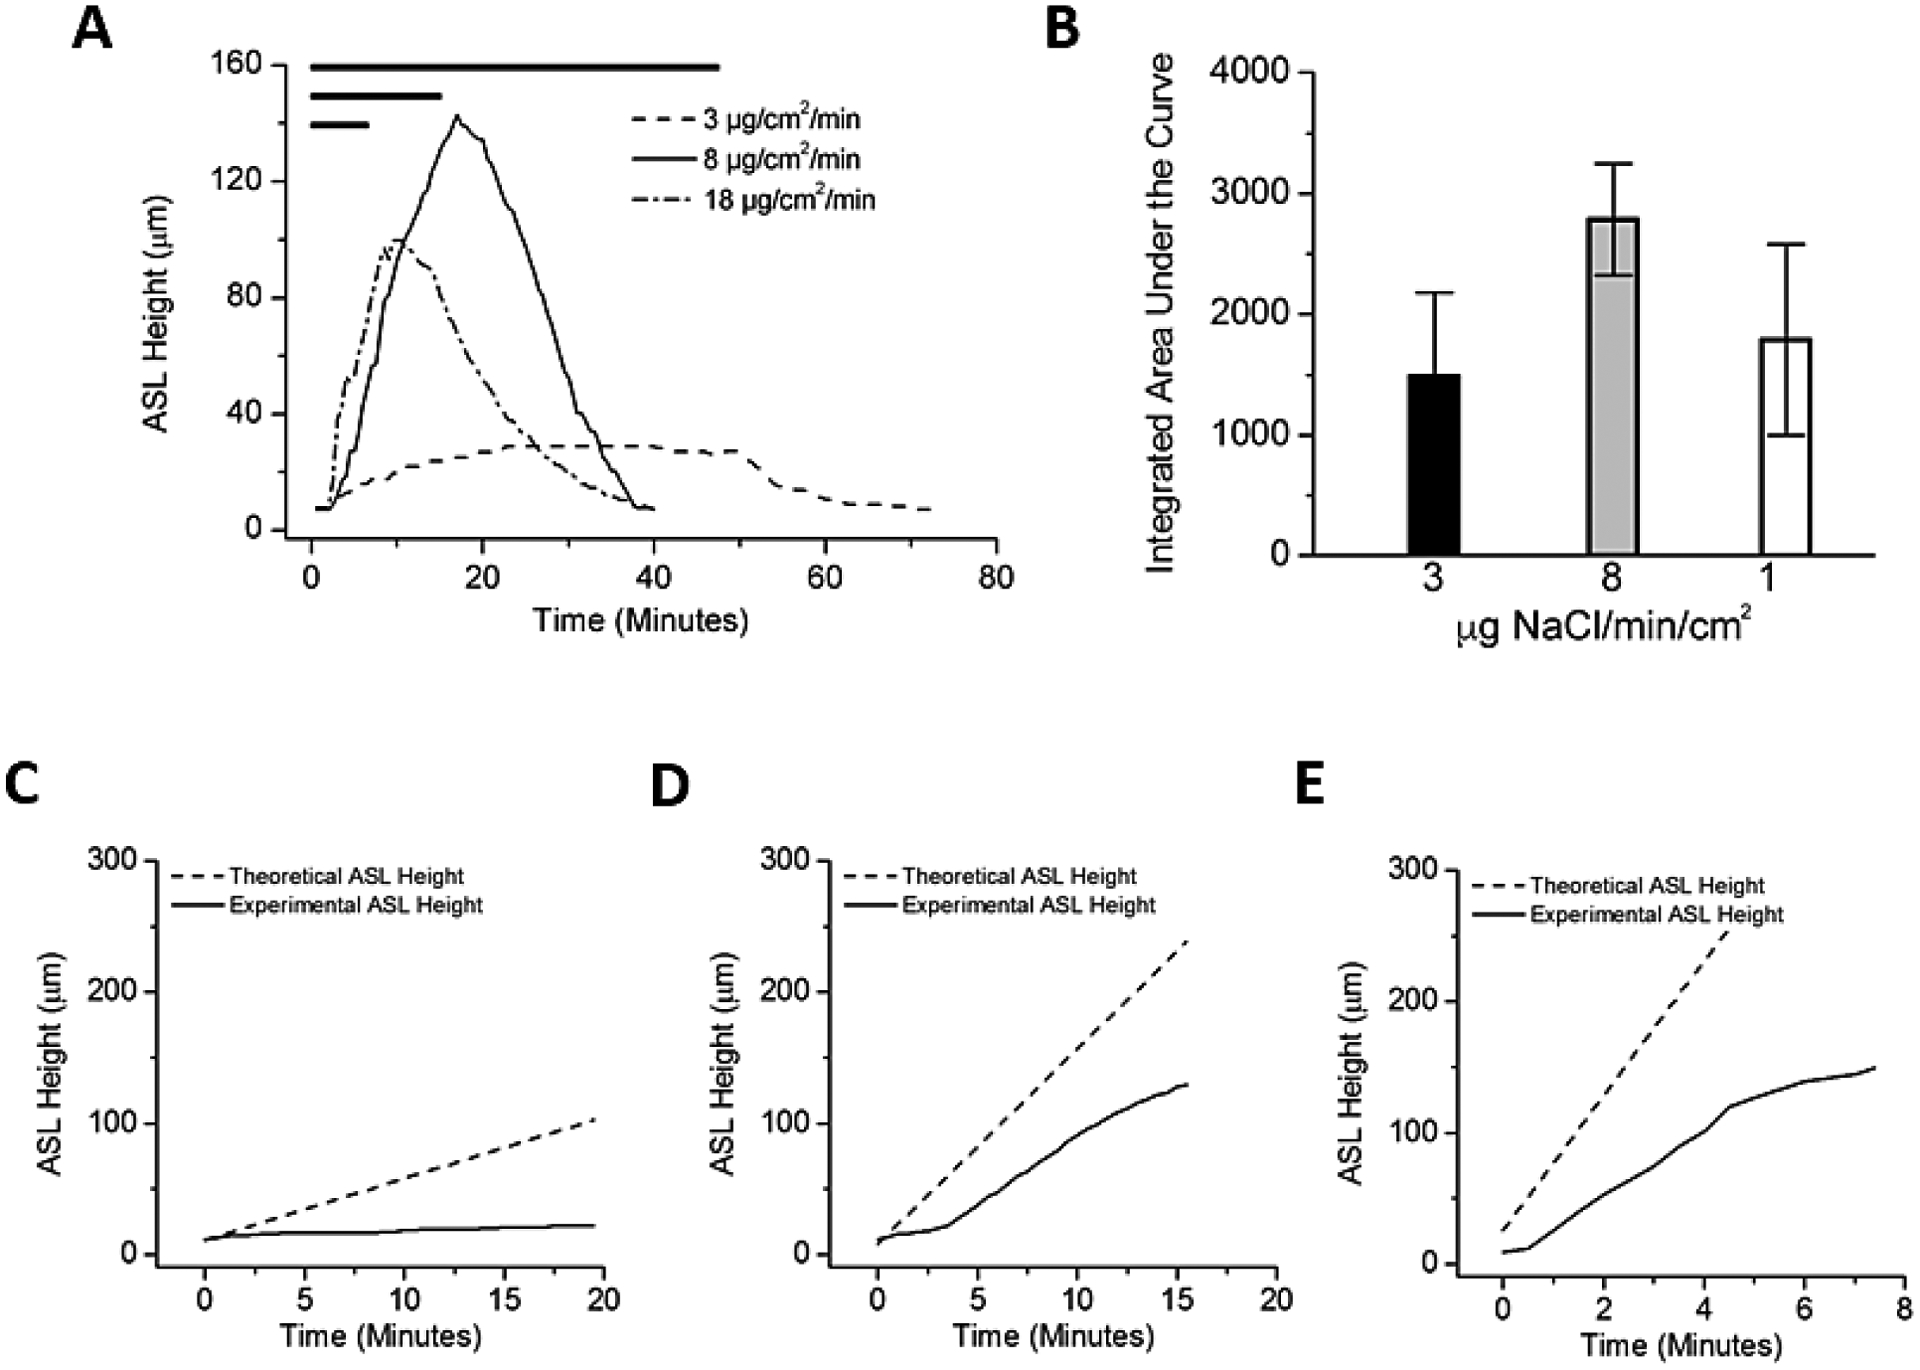
Effects of variation in HS delivery rates on ASL volumes responses. (A) Comparison of ASL heights achieved with three rates of nebulized HS (low, 3μg NaCl/cm2/min; moderate, 8μg NaCl/cm2/min; and high, 18 μg NaCl/cm2/min) with duration varied to hold constant total delivered mass of salt (demonstrated by length of bar at top). (B) Both absolute height change and total hydration (integrated area over time) favored the mid-range dosing regimen but did not reach statistical significance (A; P=0.388). (C,D,E) Dashed lines indicates the expected rise in ASL height if all salt deposited resulted in an equimolar flux of water into the ASL. Solid black lines indicate the actual change in ASL height observed during experiments. The failure of these two lines to overlay indicates an inhibition of the transport of water from the epithelial cells into the ASL. (C) Low dose nebulization (3μg NaCl/cm2/min). Theoretical slope 4.72 μm/min versus experimental slope of 0.45 μm/min, p<0.0001. (D) Medium dose nebulization (8μg NaCl/cm2/min). Theoretical slope 14.92 μm/min versus experimental slope of 8.66 μm/min, p=0.0002. (E) High dose nebulization (18μg NaCl/cm2/min). Theoretical slope 51.49 μm/min versus experimental slope of 20.78 μm/min, p=0.0004. N=4 per experimental condition.
