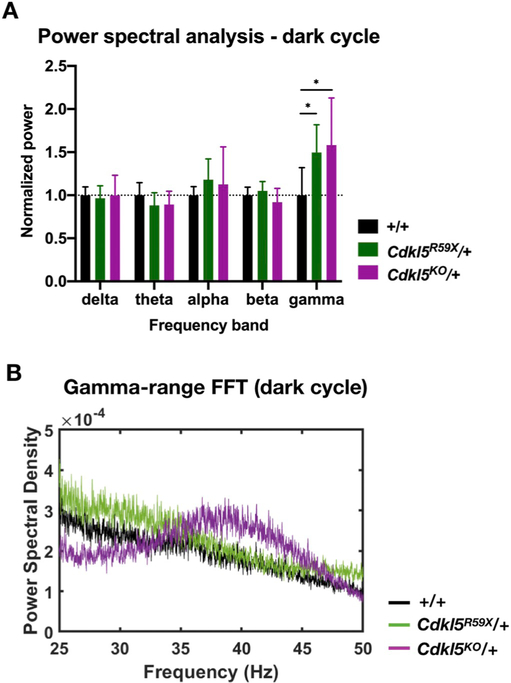
Fig. 6. Changes in background EEG in Cdkl5 mutant mice during the dark cycle.
(A) Comparison of normalized power in various frequency bands in +/+, Cdkl5R59X/+, and Cdkl5KO/+ mice during the dark cycle. For each mouse, 10 randomly selected, 10 min bins were selected and averaged. Two-way ANOVA with Dunnett's multiple comparisons test (effect of interaction between frequency band and genotype, p = .0064; +/+ vs Cdkl5R59X/+ gamma band power, p = .019; +/+ vs Cdkl5KO/+ gamma band power, p = .032). (B) Representative FFTs in the gamma range (25–50 Hz) for +/+, Cdkl5R59X/+, and Cdkl5KO/+ mice during the dark cycle. Note the elevated gamma band power in Cdkl5R59X/+ and Cdkl5KO/+ mice, relative to +/+. Sample FFTs in (B) were smoothed using a 25-point function.

