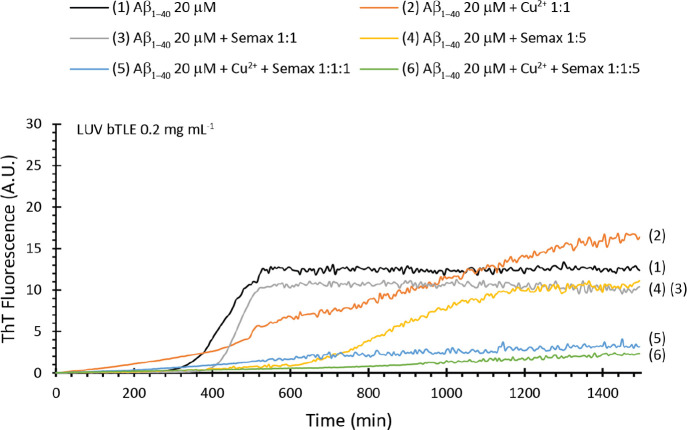
Figure 4.
Thioflavin T assay in the presence of bTLE LUVs. ThT traces of samples containing LUV bTLE 0.2 mg mL–1 and Aβ1–40 20 μM alone (black curve) and in the presence of Cu2+ 20 μM (orange curve), Semax 20 μM (gray curve), Semax 100 μM (yellow curve), Cu2+ 20 μM/Semax 20 μM (blue curve), and Cu2+ 20 μM/Semax 100 μM (green curve). All the experiments were performed at 37 °C in aCSF at pH 7.4. All traces are the average of three independent experiments.

