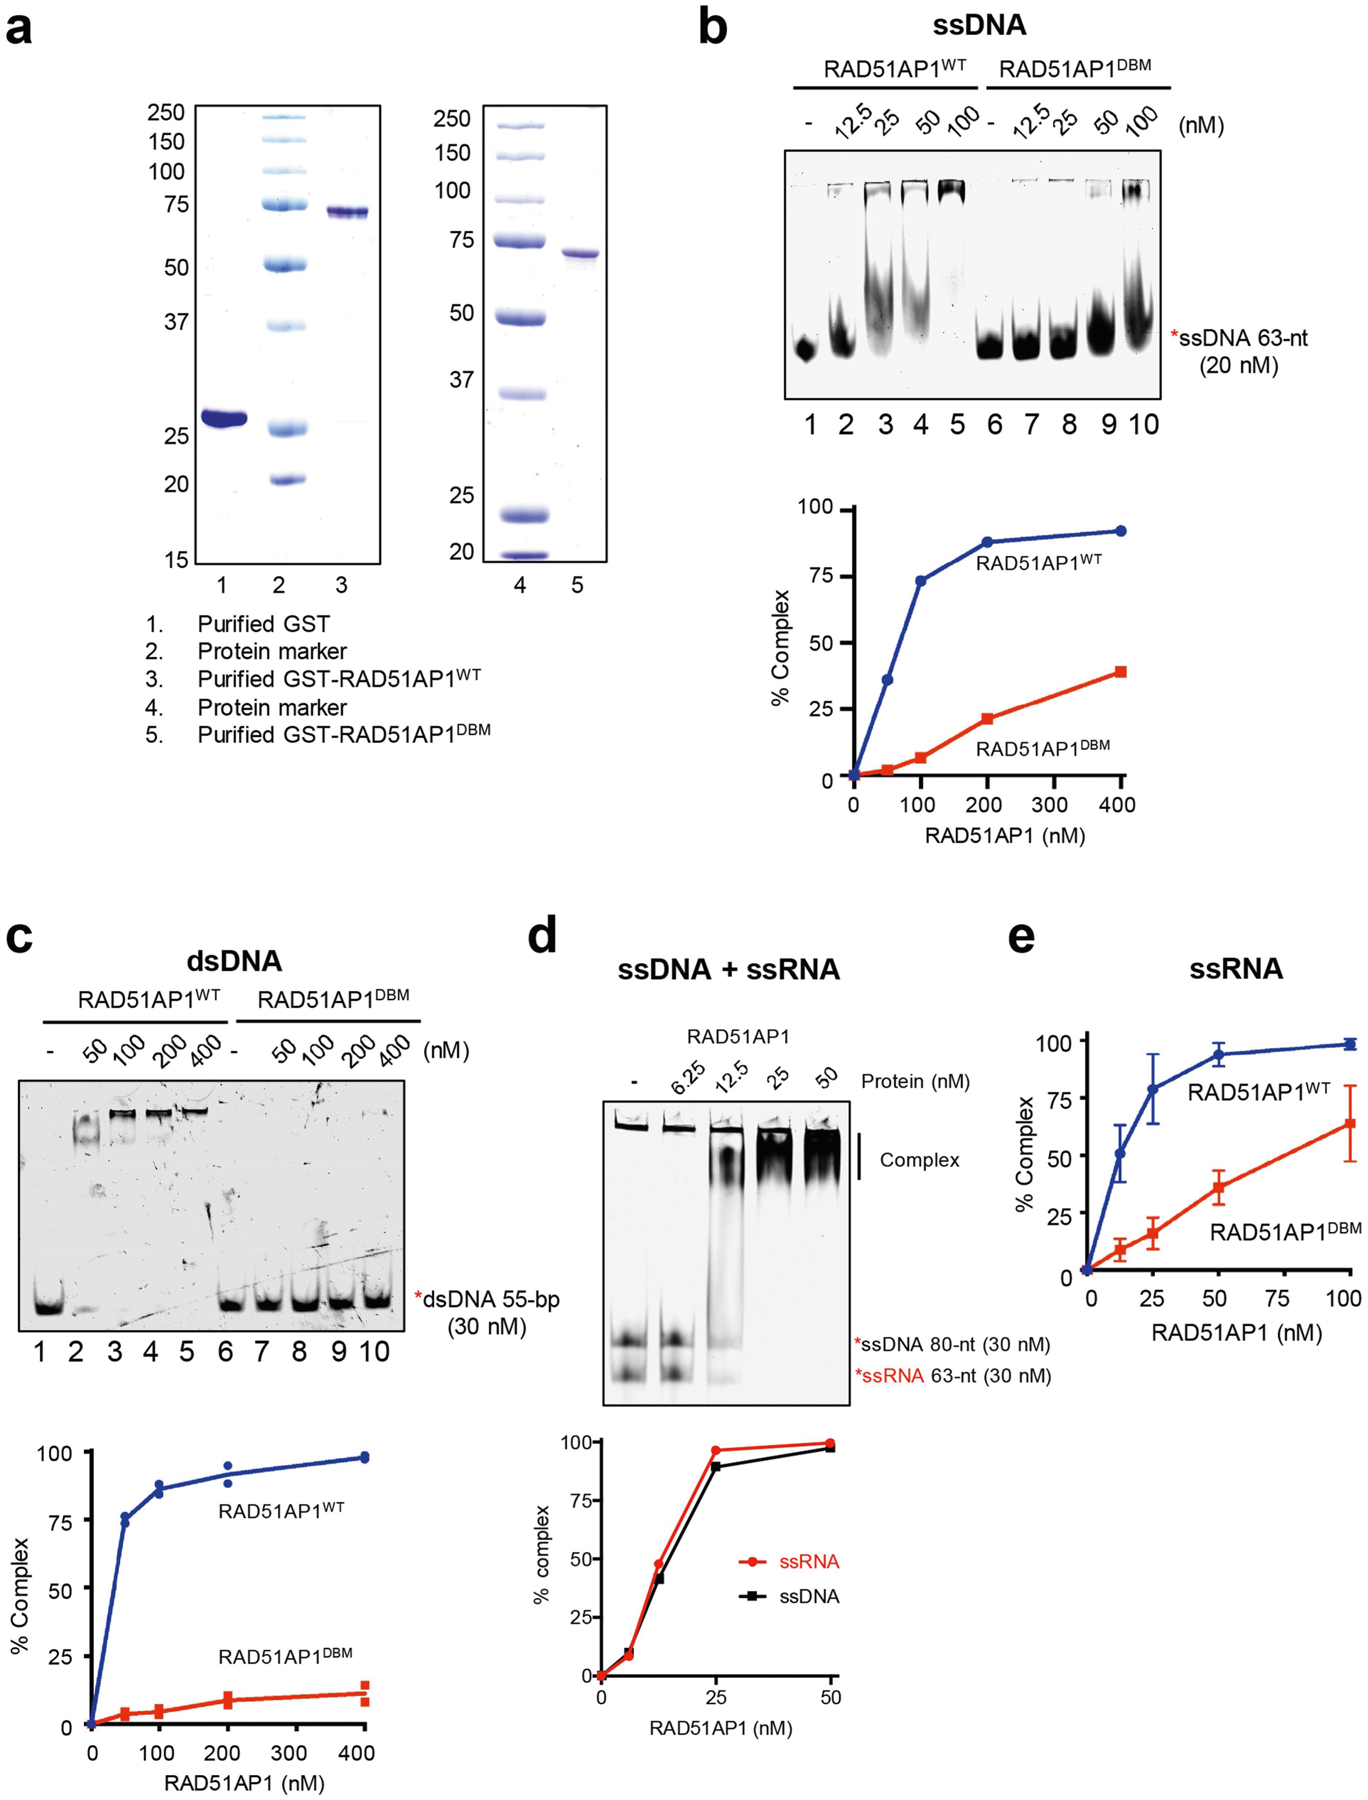
Extended Data Fig. 6 |. Characterizations of the ssDNA-, ssRNA- and dsDNA-binding activities of RAD51AP1.

a, Purified GST, GST-RAD51AP1WT and GST-RAD51AP1DBM were analysed by SDS–PAGE stained with Coomassie blue. Representative gel images from 3 similar experiments are shown. b, Increasing concentrations of RAD51AP1WT or RAD51AP1DBM (0, 12.5, 25, 50 and 100 nM) were incubated with labelled 63-nt ssDNA. Formation of the RAD51AP1–ssDNA complex was analysed by EMSA. The efficiency of complex formation was determined by quantifying the reduction in free ssDNA. Representative results from three similar experiments are shown. c, Increasing concentrations of RAD51AP1WT or RAD51AP1DBM (0, 50, 100, 200 and 400 nM) were incubated with labelled 55-bp dsDNA. Formation of the RAD51AP1–dsDNA complex was analysed by EMSA. The efficiency of complex formation was determined by quantifying the reduction in free dsDNA. Data are mean (n = 2 independent experiments). d, Increasing concentrations of RAD51AP1WT (0, 6.25, 12.5, 25 and 50 nM) were incubated with labelled 63-nt ssRNA and 80-nt ssDNA. Formation of the complex was analysed by EMSA. The efficiency of complex formation was determined by quantifying the reduction in free ssDNA or ssRNA. Representative results from three similar experiments are shown. e, In Fig. 4a, the efficiency of RAD51AP1–ssRNA complex formation was determined by quantifying the reduction in free ssRNA. Data are mean ± s.d. (n = 3 independent experiments).
