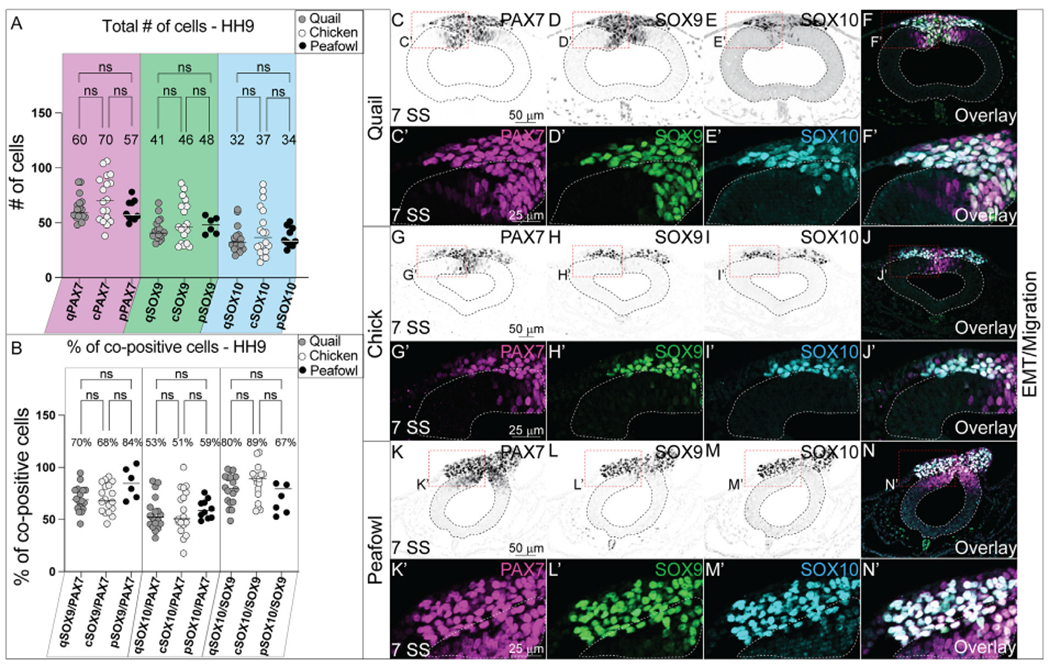
Fig. 11. Comparative expression of PAX7, SOX9, SOX10, and SNAI2 during EMT in quail, chick, and peafowl.

(A) The total number of cells for PAX7, SOX9, and SOX10 are not statistically significant between quail, chick, and peafowl. An ordinary one-way ANOVA statistical test was used (PAX7, p = 0.675–0.999, SOX9, p = 0.878–0.999, SOX10, p = 0.895–0.999). (B) Percentage of co-positive cells at HH9 between quail, chick, and peafowl shows no statistical difference. An ordinary one-way ANOVA statistical test was used (SOX9/PAX7, p = 0.9999, SOX10/PAX7, p = 0.9998, SOX10/SOX9, p = 0.8684). IHC for PAX7, SOX9, and SOX10 in (C– F′) quail, (G- J′) chick, and (K– N′) peafowl at HH9 (7 SS). Black and white images are single protein expression at indicated stage and color images are overlay of all three markers. Red dashed boxes indicate zoomed images in (C′- F′, G′- J′, and K′- N′). Neural tubes are indicated by dashed lines. Scale bars are as indicated in first panel of each row.
