
Fig. 5. SNAI2 expression timing in quail, chick, and peafowl sections.
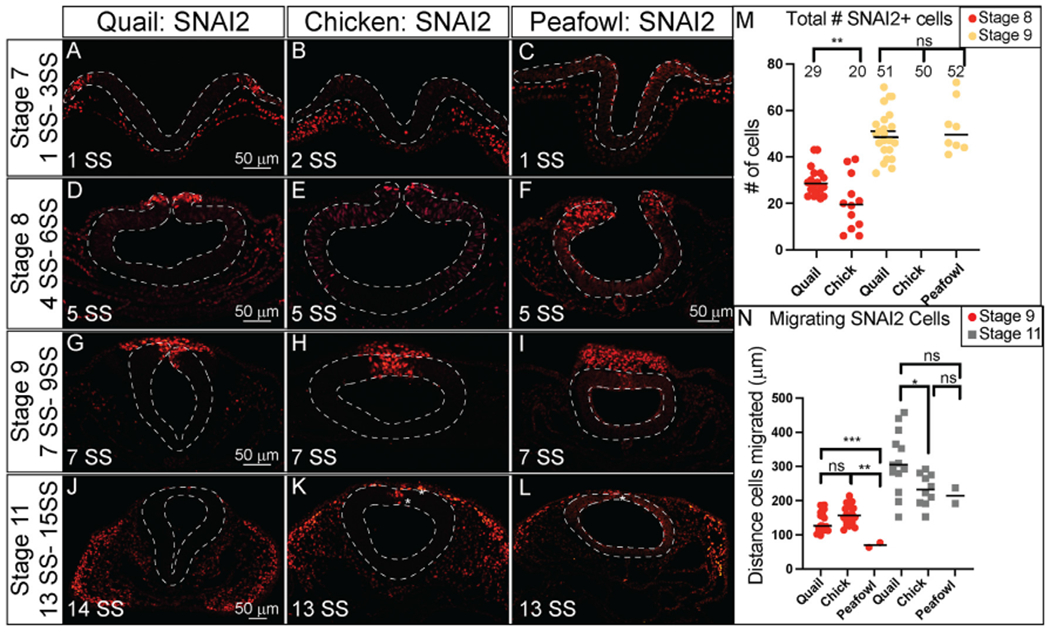
Transverse sections showing IHC for SNAI2 in multiple stages of quail, chick, and peafowl embryos in (A–C) HH7, (D–F) HH8, (G–I) HH9, and (J–L) HH11. Dorsal is to the top and ventral is to the bottom. In quail, SNAI2 is expressed at HH7 in the neural plate border (compare A to B and C), is expressed in the dorsal neural tube during neurulation/NC specification at HH8 in all three organisms (D–F), is expressed in premigratory and migratory NC cells at HH9 during EMT (G–I), and is maintained in the dorsal neural tube in a small number of premigratory NC cells but is highly expressed in migratory NC cells at HH11 (J–K). Scale bars are 50 μm and are as marked in first panel of each row. (M) The number of SNAI2+ cells were quantified for HH8 and HH9, at HH8 quail had statistically more cells than chicken, but by HH9 that statistical significance was no longer observed. Ordinary one-way ANOVA statistical test was used (HH8, p = 0.0571 and HH9, p = 0.9975). (N) Cell migration was measured from the neural tube midline to the furthest migrated cell for HH9 and HH11. At HH9, chicken and quail cells migrated further than peafowl (p = 0.004 chick and peafowl and p = 0.008 for quail and peafowl, p = 0.052 for chick and quail). At HH11, quail cells have migrated further than chick (p = 0.043 for chick and quail, p = 0.946 for chick and peafowl, and p = 0.209 for quail and peafowl). Scale bar is marked in the first image of each row or in panel F.