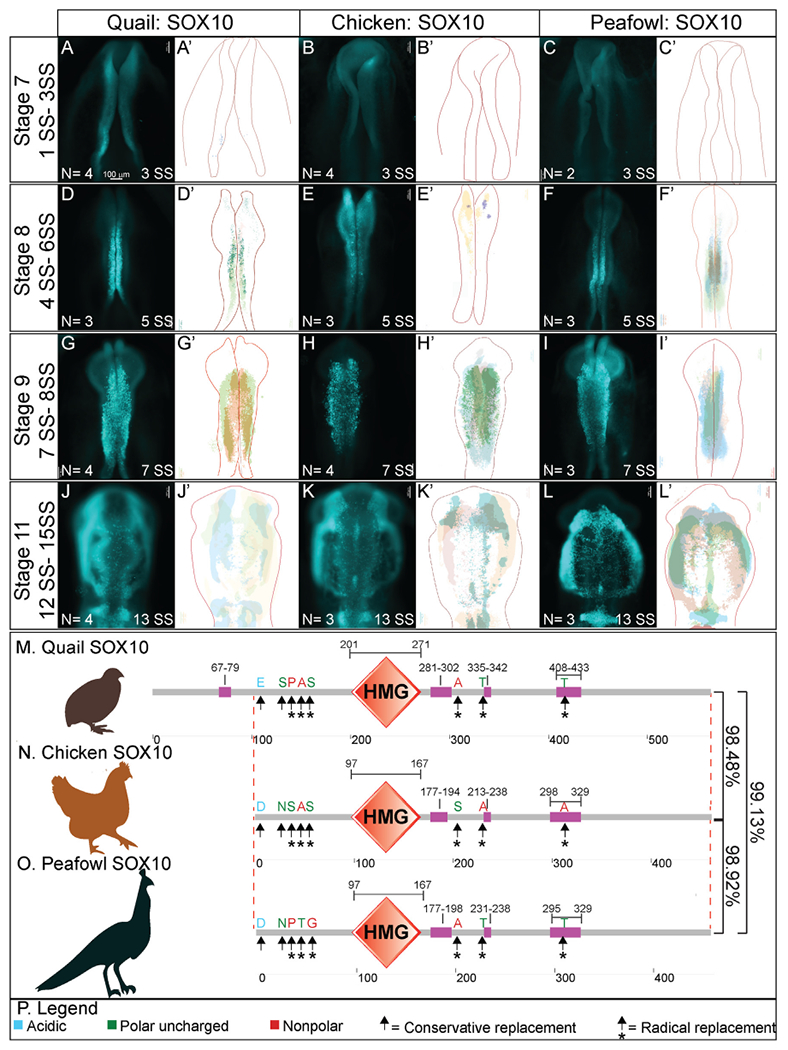
Fig. 8. SOX10 expression timing in quail, chick, and peafowl whole embryos.

IHC for SOX10 expression in (A-C′) HH8 (5 SS) dorsal neural tube, (D-F′) HH9 (7 SS) EMT stage NC cells, and (G-I′) HH11 (13 SS), neural tube and migratory NC cells. (A, D, G) in quail, (B, E, H) in chick, and (C, F, I) in peafowl embryos. (A′- C′, D′- F′, G′- 1′) schematic overlays of multiple embryos. Peafowl embryos have delayed migration of SOX10+ cells compared to chick and quail as the cells remain visible in the dorsal focal plane (compare I to G and H). Number of embryos analyzed at each stage and used for schematic overlays indicated in IHC panels. Scale bar is 100 μm and all images were taken at the same magnification. (J–L) Amino acid sequences were aligned and compared, then analyzed in SMART to obtain domain diagrams. HMG domains (orange) and low complexity domains (pink) are shown on schematics. (J–L) Peafowl SOX10 differs from the other proteins profiled here. It shares amino acid sequences with both chick and quail (same type of amino acid, black arrow, different type of amino acid black arrow plus asterisk), and has one amino acid that is unique from both chick and quail, which resemble each other. (M) Legend for (J–L). Blue is acidic amino acid, green is polar uncharged, red is nonpolar. Scale bar for all whole mount images is 100 μm and is marked in the first image.
