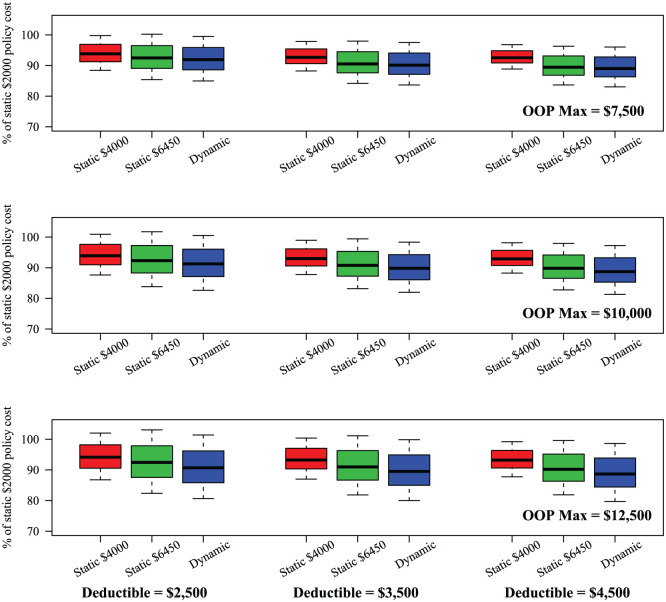
Figure 6.
Sensitivity analysis to changes in health plan parameters. Other parameters held at: Initial cost percentile , 25% tax rate. Columns: The left, middle, and right columns displays results for deductible values of $2,500, $3,500, and $4,500, respectively. Rows: The top, middle, and bottom rows represent OOP maximum values of $7,500, $10,000, and $12,500, respectively.

