
Figure 1:
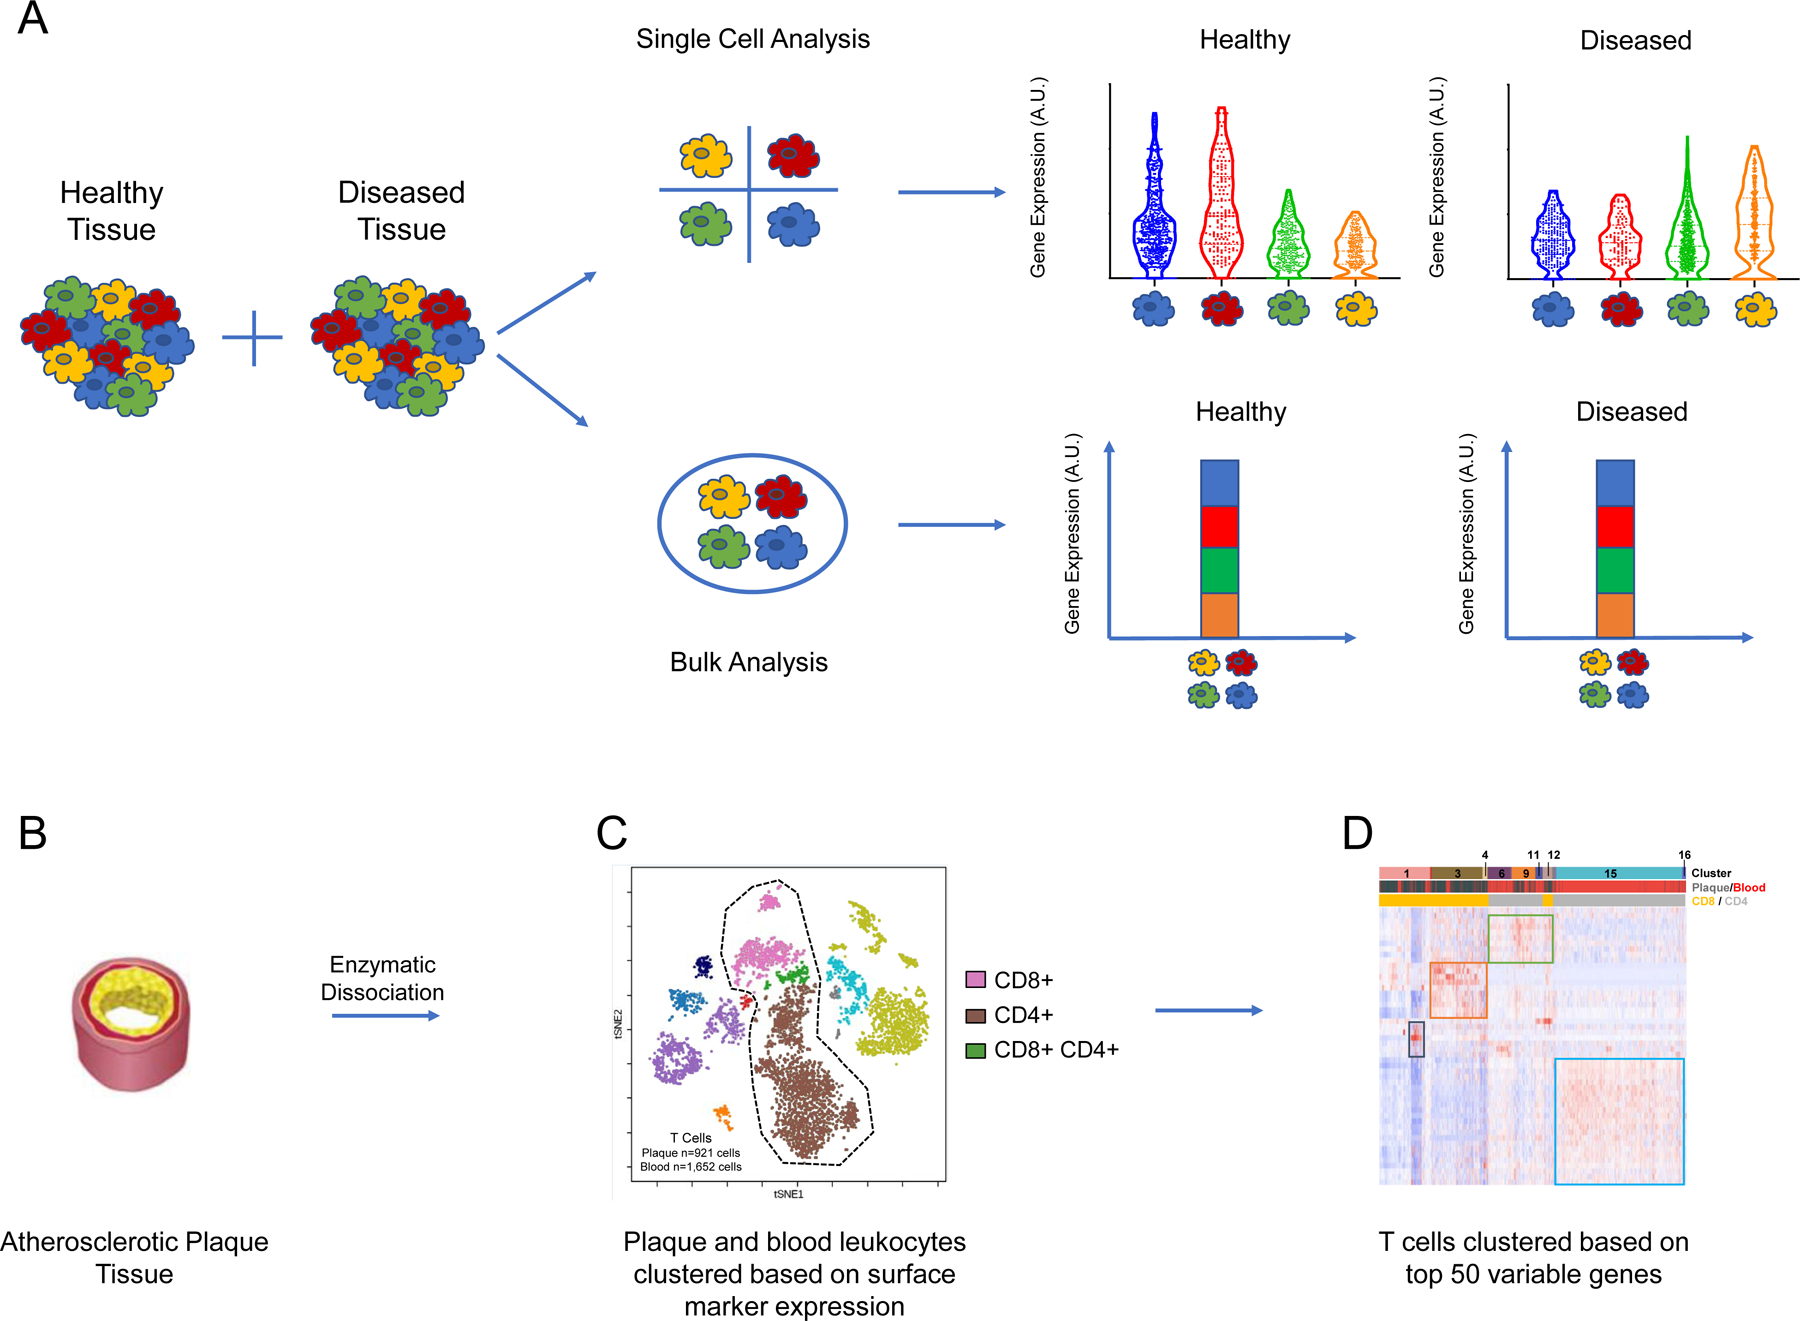
Single-cell approaches unveil disease-relevant heterogeneity among cellular populations
(A) Single cell approaches reveal heterogeneity between individual cells that is obscured by bulk approaches. In this example experiment, distinct transcriptomic profiles are revealed between subpopulations of cells in healthy versus diseased tissues. (C) tSNE plot displaying cells derived from plaque and blood of patients with atherosclerosis (n = 5,362 cells). Cells are clustered using a 21-marker antibody-derived tag (ADT) panel. This proteomic analysis reveals major populations of cells including CD4+, CD8+, and double positive T cells. (C) Heatmap of T cells from plaque and blood (n = 2,573 cells) hierarchically clustered based on top 50 variable genes. The first banner denotes the 16 distinct clusters of T cells that were uncovered. The second banner indicates the cells’ origins from plaque or blood, and the bottom banner indicates the cluster’s identity as CD8+ or CD4+ T cells. The heat map was made using the Fernandez et al. 2019 dataset.