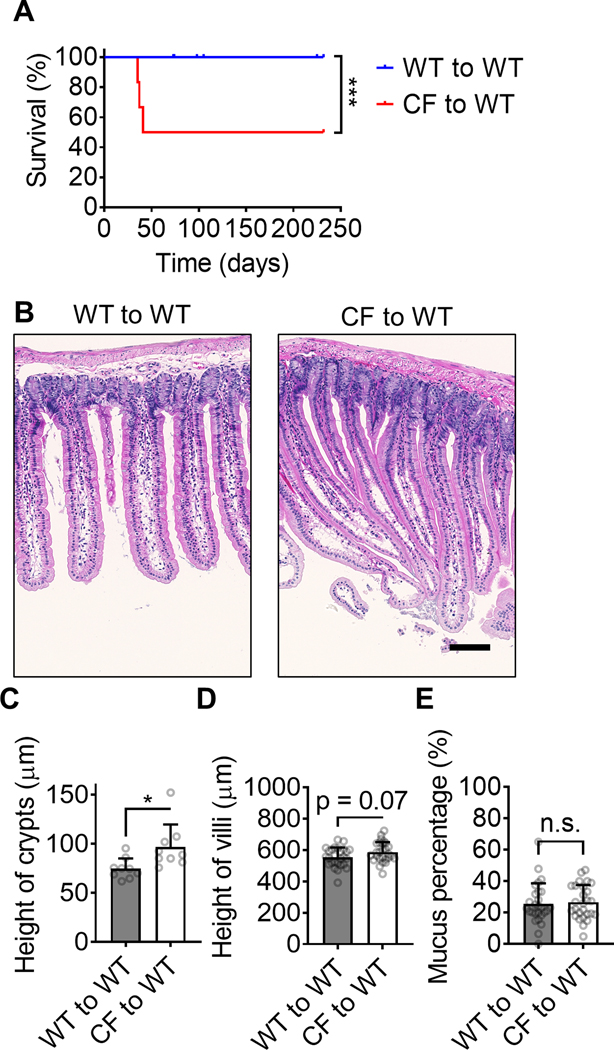
FIGURE 3.
CFTRΔF508 Bone marrow transplantation induces the disease in WT mice. (A) the survival curve of WT mice (1100 rads) transplanted with WT (blue curve, n=21) or CFTRΔF508 (red curve, n=6) BM. (B) Typical H&E staining images of intestines from WT mice transplanted with CFTRΔF508 or WT BM. (C-D) Quantification of crypts (C, Mean±SD of n=9) and villi (D, Mean±SD of n=27) height of intestines from WT mice transplanted with CFTRΔF508 or WT BM. n=9. (E) Percentage of intestine crypts that contain mucus in it. WT mice are transplanted with WT or CFTRΔF508 BM. Mean±SD of n=27. n.s. p>0.05, *p<0.05, ***p<0.001 in the Gehan-Breslow-Wilcoxon test (A) and student t-test (C-E). Scale bars are 100 μm.

